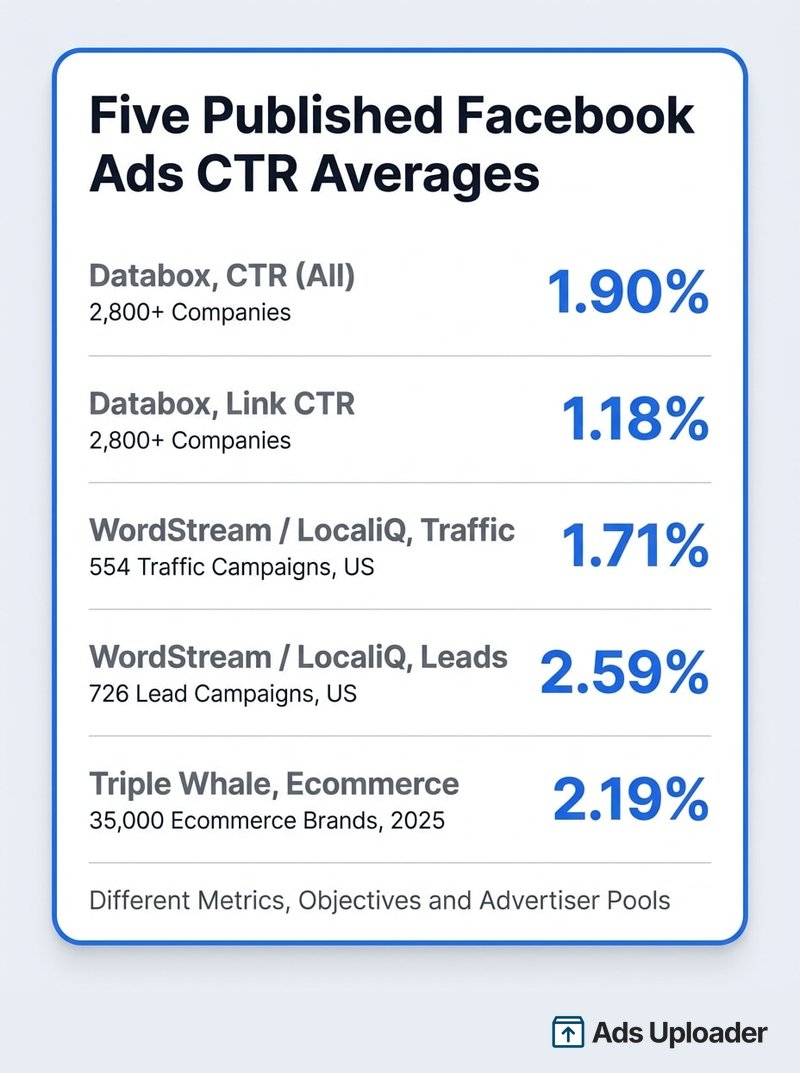
Facebook ads CTR is the percentage of ad impressions that produced a click, and Ads Manager reports it in more than one way. CTR (all) counts every click Meta records, including reactions, comments, shares and media expansions, while CTR (link click-through rate) counts only clicks to a destination you chose. In Databox's benchmark pool of over 2,800 companies, updated August 2026, the median is 1.9% for CTR (all) and 1.18% for link CTR. Published averages disagree mostly because they measure different columns.
Open any two benchmark reports and you will get two different answers about what an average CTR is. One says 0.90%, another says 1.71%, a third says 2.19%. None of them is lying. They are measuring different click types, different campaign objectives, and different groups of advertisers, and almost none of them tells you which Ads Manager column the number came from.
That matters, because the first thing most people do with a benchmark is judge their own account against it. If you compare your link CTR to somebody else's clicks-all average, you will conclude your creative is failing when it may be perfectly normal.
This guide pulls the current numbers together with their sources attached: CTR benchmarks by industry, by objective and by placement, what counts as good, how much data you need before the number means anything, and a diagnosis path for when yours is genuinely low.
What CTR Means in Facebook Ads
The formula is the easy part. CTR is clicks divided by impressions, multiplied by 100. If 10,000 people saw your ad and 150 clicked, your CTR is 1.5%.
The complication is that Meta counts several kinds of clicks, and reports them as separate columns:
- CTR (all) divides every click Meta records by impressions. That includes link clicks, but also post reactions, comments, shares, clicks on your Page or profile name, and clicks that expand media such as opening a photo. Meta's CTR (all) definition is the reference for what the column contains.
- CTR (link click-through rate) divides only link clicks by impressions. A link click is a click to a destination or experience you specified, which can be your website, an app store, an Instant Form, an Instant Experience, or a click-to-message thread. Meta's link CTR definition covers the exact calculation.
- Outbound CTR is narrower still. An outbound click has to take the person off Meta's apps entirely, so a click that opens an Instant Form or a Messenger thread counts as a link click but not an outbound click. Meta explains the gap in its guide to the difference between link clicks and outbound clicks.
- Unique CTR versions of both metrics count people rather than clicks, using reach as the denominator, so someone who clicks three times only counts once.
The practical consequence is large. Across Databox's benchmark pool, the median CTR (all) is 1.9% while the median link CTR is 1.18%, so the all-clicks version runs roughly 60% higher on the same population of advertisers. An engagement-heavy ad can post a flattering CTR (all) while sending very little traffic anywhere.
One working rule solves most of the confusion: pick one CTR column per report, use it consistently, and write down which one you picked.
Average CTR for Facebook Ads: What Each Source Measures
Here are the current published figures with the detail that makes them comparable. Every number below is attributed to the publisher that produced it, since we do not publish account data of our own.
| Source | Reported CTR | Dataset | Period | Metric measured |
|---|---|---|---|---|
| Databox, Facebook Ads benchmarks | 1.9% CTR (all), 1.18% link CTR (medians) | 2,800+ companies, 100+ industries | Rolling, updated August 2026 | Both, named separately |
| WordStream and LocaliQ, Facebook Ads Benchmarks 2025 | 1.71% traffic, 2.59% leads | 554 traffic and 726 lead campaigns, US | April 2024 to June 2025 | Not stated |
| Triple Whale | 2.19% median, up 13.5% year over year | Nearly 35,000 ecommerce brands | Full-year 2025 | CTR (all) |
| Superads | Monthly medians from 1.87% to 2.34% | Thousands of accounts, over $3 billion in spend | July 2025 to July 2026 | Not stated |
| Varos | 1.06% median | 5,000+ companies | April 2025 snapshot | Not stated |
Five reputable datasets, five different answers, and the spread is explainable:
- Different click numerators. Databox's own pool shows CTR (all) sitting about 60% above link CTR. Any benchmark that quietly uses clicks-all will look higher.
- Different objectives. WordStream and LocaliQ report 1.71% for traffic campaigns and 2.59% for leads campaigns from the same report.
- Different advertiser populations. Triple Whale's brands are ecommerce; LocaliQ's are largely US local businesses; Databox spans more than 100 industries.
- Different aggregation. A median of account-level CTRs is not the same as pooling every impression and click into one ratio.
- Different auction conditions. Triple Whale reported median CPM rising 20.03% across 2025 in the same dataset where median CTR rose 13.5%.
The often-quoted 0.90% all-industry average comes from WordStream's older benchmarks page, which states its sample as 256 US accounts advertising between November 2016 and January 2017 using the Clicks (All) metric. It is still widely cited, and it is nearly a decade old.
A fair summary of the current picture: recent medians cluster around 1.9% to 2.2% where the metric includes all clicks, and the one benchmark that explicitly isolates link CTR puts the median at 1.18%.
Facebook Ads CTR Benchmarks by Industry
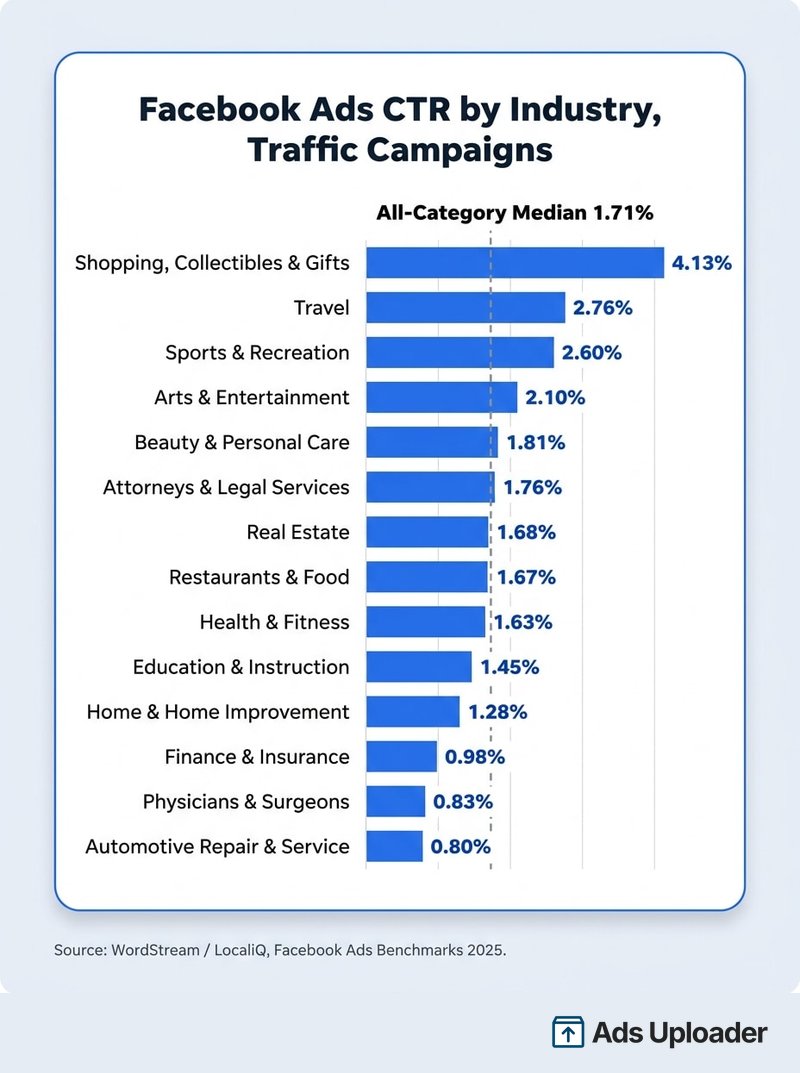
For US advertisers running traffic and lead campaigns, the most detailed recent set comes from WordStream and LocaliQ's 2025 Facebook Ads benchmarks report, covering April 2024 through June 2025. For the wider Meta benchmark picture, with CPM, CPC, and CPA alongside CTR, see our Meta ads statistics.
| Business category | Traffic-campaign CTR | Leads-campaign CTR |
|---|---|---|
| Shopping, Collectibles & Gifts | 4.13% | not published |
| Travel | 2.76% | not published |
| Sports & Recreation | 2.60% | 3.41% |
| Arts & Entertainment | 2.10% | 3.92% |
| Beauty & Personal Care | 1.81% | 2.55% |
| Attorneys & Legal Services | 1.76% | 2.11% |
| Personal Services | 1.70% | 1.99% |
| Real Estate | 1.68% | 3.75% |
| Restaurants & Food | 1.67% | 2.97% |
| Animals & Pets | 1.64% | not published |
| Health & Fitness | 1.63% | 1.72% |
| Automotive, For Sale | 1.48% | not published |
| Education & Instruction | 1.45% | 1.86% |
| Furniture | 1.39% | 1.48% |
| Business Services | 1.38% | not published |
| Industrial & Commercial | 1.36% | 2.08% |
| Apparel, Fashion & Jewelry | 1.29% | not published |
| Home & Home Improvement | 1.28% | 1.94% |
| Finance & Insurance | 0.98% | not published |
| Physicians & Surgeons | 0.83% | 3.02% |
| Automotive, Repair & Service | 0.80% | not published |
| Career & Employment | not published | 2.81% |
| Dentists & Dental Services | not published | 1.05% |
| All categories | 1.71% | 2.59% |
Ecommerce brands sit higher, and in a different dataset. Triple Whale's 2025 report, covering nearly 35,000 ecommerce brands, uses CTR (all) and puts the overall median at 2.19%, with health and wellness highest at 2.70% and food and beverage lowest at 1.85%. Every vertical in that dataset improved year over year.
Do not stack the two tables on top of each other. They cover different advertisers and, as far as each publisher discloses, different click definitions. Use the one that resembles your account.
Two reading notes that save arguments with clients. First, low-CTR categories are not failing categories: automotive repair at 0.80% and physicians at 0.83% are selling considered, often urgent services to people who are not browsing for them. Second, a high category average does not transfer to your account if your offer, geography or funnel stage differs.
Facebook Ads CTR by Campaign Objective
Objective moves CTR more than most people expect, because it changes who Meta shows the ad to and what it optimizes for.
| Objective | Reported CTR | Source |
|---|---|---|
| Traffic | 2.80% | Varos, April 2025 |
| Leads | 2.59% | WordStream and LocaliQ, 2025 |
| Traffic | 1.71% | WordStream and LocaliQ, 2025 |
| Leads | 1.68% | Varos, April 2025 |
| Sales | 0.82% | Varos, April 2025 |
| Engagement | 0.15% | Varos, April 2025 |
Varos also publishes middle-50% ranges for those objectives, and they are wide: 1.34% to 5.05% for traffic, 0.45% to 3.15% for leads, and 0.43% to 1.17% for sales. Neither publisher states which Ads Manager CTR column sits behind their figures.
The 0.15% engagement figure is a useful warning. An engagement campaign should generate plenty of non-link clicks, so a figure that low suggests the number is closer to link CTR than clicks-all, or that the campaign population is unusual. When a benchmark surprises you, the metric definition is usually the explanation.
The practical takeaway is that sales campaigns will normally show lower CTR than traffic campaigns, and that is by design. Meta is optimizing toward people likely to buy, not people likely to click. Judging a sales campaign against a traffic benchmark is the most common CTR mistake in this space.
Launch More. Click Less.
Upload hundreds of creatives at once, auto-match thumbnails to videos, and export directly to Meta Ads Manager.
Try Ads Uploader FreeNo credit card required • 7-day free trial
Facebook Ads CTR by Placement
Placement changes the number too, and it is the layer people forget when a campaign-level CTR moves without any creative change.
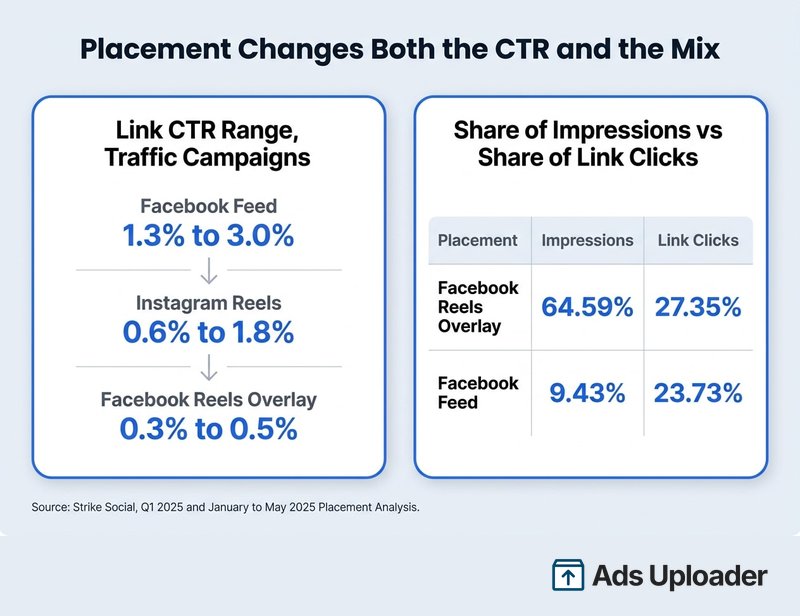
Strike Social's Q1 2025 benchmark report, based on US campaigns run through its Campaign Lab, reports these link CTR ranges for traffic campaigns:
- Facebook Feed: 1.3% to 3.0%
- Instagram Reels: 0.6% to 1.8%
- Facebook Reels Overlay: 0.3% to 0.5%
The same firm's January to May 2025 placement analysis, covering nearly 60 million impressions across more than 18 placements, found Reels Overlay absorbed 64.59% of impressions while producing 27.35% of link clicks. Facebook Feed took 9.43% of impressions and produced 23.73% of link clicks.
That imbalance is the mechanism behind a lot of unexplained CTR drops. If delivery shifts toward cheap, high-volume placements, your blended CTR falls even when every individual creative is performing exactly as it did last month. Check the placement breakdown before you rebuild the creative.
Lower CTR on a placement is also not a reason to switch it off. Meta's own Reels testing found that native 9:16 video with sound and safe-zone-compliant messaging delivered 34.5% lower cost per result than image ads in Reels, across a meta-analysis of 15 split tests. Cheaper results with fewer clicks is a trade most advertisers would take.
What Is a Good CTR for Facebook Ads?
A good CTR has three parts: it beats your own account baseline, it sits in a sensible range for your objective and industry, and it arrives with an acceptable cost per result.
For the middle part, Databox's distribution across more than 2,800 companies is the most useful calibration available, because it separates the two metrics:
| Metric | Bottom quartile boundary | Median | Top quartile boundary |
|---|---|---|---|
| CTR (all) | 1.19% | 1.9% | 3.24% |
| Link CTR | 0.80% | 1.18% | 1.95% |
Read that as bands rather than targets:
- Link CTR below 0.8% is weak against that pool. Worth investigating unless clicks are secondary to your objective.
- Link CTR of 1% to 1.5% is normal to healthy.
- Link CTR of 2% or more is strong on the click dimension, which is not the same as profitable.
- CTR (all) around 1.9% is ordinary, not exceptional. A 1% CTR (all) is on the weak side.
Those bands are an editorial reading of Databox's distribution, not official Meta thresholds. Meta defines each CTR metric precisely, but as of August 2026 its public documentation carries no all-advertiser average to aim at. What Meta does offer is personalized benchmarking inside Ads Reporting, which compares eligible ad sets against similar advertisers in your own account view.
When a High CTR Is the Wrong Signal
Clicks are a means, not the goal, and CTR can rise for reasons you do not want. Triple Whale's 2025 data contains a clean example: the travel accessories and luggage vertical lifted median CTR 17.09% year over year while median conversion rate fell 16.72%. More people clicked, fewer of them bought.
The usual causes of a flattering CTR are engagement clicks inflating CTR (all), curiosity hooks that attract browsers rather than buyers, cheap placements producing accidental taps, and an ad that promises something the landing page does not deliver.
How Many Impressions Before CTR Means Anything
CTR is a proportion, so small samples produce wide uncertainty. At 1,000 impressions with 10 clicks, the 95% confidence interval around that 1% CTR runs from roughly 0.54% to 1.83%. At 10,000 impressions with 100 clicks, it tightens to about 0.82% to 1.22%.
Comparing two ads needs more data again. At 80% power and 5% two-sided significance, telling a 1.0% CTR apart from a 1.5% CTR takes roughly 7,750 impressions per ad. A 1.0% versus 2.0% gap needs about 2,320 per ad.
Two caveats worth remembering: Meta's delivery is adaptive rather than randomized, so two ads in one ad set rarely get equivalent traffic, and a confidence interval only measures sampling noise, not differences in audience, placement or time of day.
Save Hours on Creative Testing
Stop uploading ads one by one. Bulk process unlimited creatives with automatic media matching and direct API publishing.
Try Ads Uploader FreeNo credit card required • 7-day free trial
How to Check Facebook Ads CTR in Ads Manager
The columns you need are not in the default view:
- Open the campaign, ad set or ad view in Ads Manager.
- Open the Columns menu and choose Customize columns.
- Add CTR (all), CTR (link click-through rate) and outbound CTR, plus impressions, reach, link clicks, landing page views and cost per result.
- Save the selection as a preset so every report uses the same definitions.
- Use Breakdown to split by placement, platform, impression device and time.
Judge creative at ad level, not campaign level. A campaign-level CTR blends placements, audiences and creative into one number that hides the thing you are trying to see. The most revealing view is the click chain: link clicks, then outbound clicks, then landing page views, then conversions. Each drop-off points somewhere different.
Why Your Facebook Ads CTR Is Low
Work through these in order. The early items are cheaper to check and more often the cause.
- Metric mismatch. Confirm you are comparing link CTR to a link CTR benchmark, and this month's column setup to last month's.
- Objective mismatch. A sales campaign optimized for purchases will show lower CTR than a traffic campaign, and that is expected behavior.
- Frequency and creative wear-out. If CTR declines while frequency climbs on aging creative, and nothing else changed, you are looking at ad fatigue rather than a targeting problem.
- Placement mix. Check the placement breakdown before touching creative. Cheap inventory can drag blended CTR down on its own.
- Cropping and safe areas. A 1:1 asset stretched into a 9:16 Reels slot can lose its headline or price behind the interface. Meta's safe zone rules govern where key elements survive across placements.
- The hook and the first line. Meta's creative guidance puts key messaging and branding in the first three seconds of video and keeps primary text concise, since only two or three lines show before the "See more" cut. The character limits by placement decide what people actually read.
- Audience and offer mismatch. If the benefit needs a paragraph to explain, or the offer targets a level of awareness the audience has not reached, CTR reports that as a low number.
- Everything downstream. A weak landing page cannot lower the CTR of the impression that preceded it. It shows up in landing page views, conversion rate and cost per result instead, so when clicks land but do not convert, the fix is split testing your landing pages rather than the ad.
One extra pattern worth naming: a high CTR (all) with a low link CTR means people are interacting with the ad but not pursuing the destination. That is usually a CTA clarity problem, not a creative attention problem.
How to Improve Facebook Ads CTR With Creative Variety
Meta's delivery system is choosing between creative candidates on your behalf, so the most reliable lever is giving it genuinely different things to choose from.
Vary the concept, not the color. Different customer problems, different mechanisms, offer-led versus product-led angles, demonstrations, testimonials and comparisons. Motion's 2026 creative study, covering 578,750 creatives and $1.29 billion in spend, found only about 5% of creatives cleared its spend-based definition of a winner. That is not proof that volume causes performance, but it does explain why running one or two concepts is fragile.
Match the format to the placement. Vertical video for Reels and Stories, 4:5 for feed. Carousel ads suit multi-angle proof and product ranges, where a single image has to pick one story. Flexible ads let Meta assemble combinations from an asset pool, which is a cheap way to widen variety without producing entirely new concepts.
Test hooks separately from concepts. Start with different promises, then different openings inside the concepts that show promise, then proof and objection handling, and only then wording and CTA details. Colour swaps and headline tweaks rarely teach you anything strategic.
Keep the offer legible at a glance. What it is, who it is for, the main benefit, why it is credible, and what happens next. Meta's tailored campaign guidance asks for exactly this: clear value, simple image text, an obvious focal point.
Read CTR next to cost per result. CTR is a good screening metric for stopping power and a poor decision metric on its own. Use it to spot which creative earns attention, then let cost per result and conversion rate pick the winner.
Two things to avoid. Engagement bait is explicitly named by Meta as a low-quality attribute in its explanation of how ad delivery machine learning works, alongside sensational language, and Meta says auction value comes from your bid, estimated action rate and ad quality rather than CTR itself. And reusing a post ID to carry accumulated likes and comments does preserve social proof, but no transparent recent dataset isolates its effect on CTR, so treat it as a credibility tactic rather than a performance guarantee.
Frequently Asked Questions
What is a good CTR for Facebook ads? Name the metric first. In Databox's pool of more than 2,800 companies, updated August 2026, median link CTR is 1.18% and median CTR (all) is 1.9%. Roughly 1% to 1.5% link CTR is normal to healthy, and 2% or above is strong on clicks. It only counts as good if cost per result is acceptable too.
Is a 1% CTR good on Facebook ads? A 1% link CTR is acceptable, sitting above the 0.80% bottom-quartile boundary but below the 1.18% median in that same benchmark pool. A 1% CTR (all) is weak, since the bottom-quartile boundary there is 1.19%.
What is the difference between CTR (all) and CTR (link click-through rate)? CTR (all) counts every click Meta records, including reactions, comments, shares, Page clicks and media expansions. Link CTR counts only clicks to destinations you specified. On the same advertisers in Databox's data, CTR (all) runs about 60% higher.
Why is my Facebook ads CTR so low? Check the metric definition, then the campaign objective, then frequency on aging creative, then the placement breakdown, then the creative itself. Comparing a link CTR to a clicks-all benchmark is the most common false alarm.
Does CTR affect how much Facebook ads cost? It lowers CPC at a fixed CPM, since CPC is CPM divided by clicks per thousand impressions. It does not independently set your CPM. Meta names bid, estimated action rate and ad quality as the auction inputs.
Can a high CTR be a bad thing? Yes, when clicks come from curiosity, engagement or accidental taps. Triple Whale's travel accessories vertical raised CTR 17.09% year over year while conversion rate fell 16.72%.
How many impressions do I need before CTR is reliable? At 1,000 impressions a 1% CTR carries a confidence interval of roughly 0.54% to 1.83%. Separating a 1.0% CTR from a 1.5% CTR takes around 7,750 impressions per ad at 80% power.
What CTR should I expect from Reels versus Feed? Strike Social's Q1 2025 US traffic data reports 1.3% to 3.0% link CTR for Facebook Feed, 0.6% to 1.8% for Instagram Reels and 0.3% to 0.5% for Facebook Reels Overlay. Compare cost per result before you exclude a placement on CTR alone.
The Short Version
Facebook ads CTR is only useful once you know which version of it you are reading. Before you act on a number:
- Name the column. CTR (all) runs roughly 60% above link CTR on the same accounts, so half of all benchmark comparisons are apples to oranges.
- Match the benchmark to the campaign. Traffic, leads and sales objectives produce different CTR ranges by design, and ecommerce sits above local services.
- Use bands, not targets. Link CTR of 1% to 1.5% is ordinary, 2% or more is strong, below 0.8% is worth investigating.
- Check volume before you conclude. A CTR read on a few thousand impressions usually cannot tell 1% and 1.5% apart.
- Diagnose in order. Metric, objective, frequency, placement, then creative.
The most reliable way to raise CTR is still the least glamorous one: run more genuinely different creative concepts, adapt them properly to each placement, and let cost per result decide the winner. CTR tells you which ads earn attention. Your cost per result tells you which ads earn money.