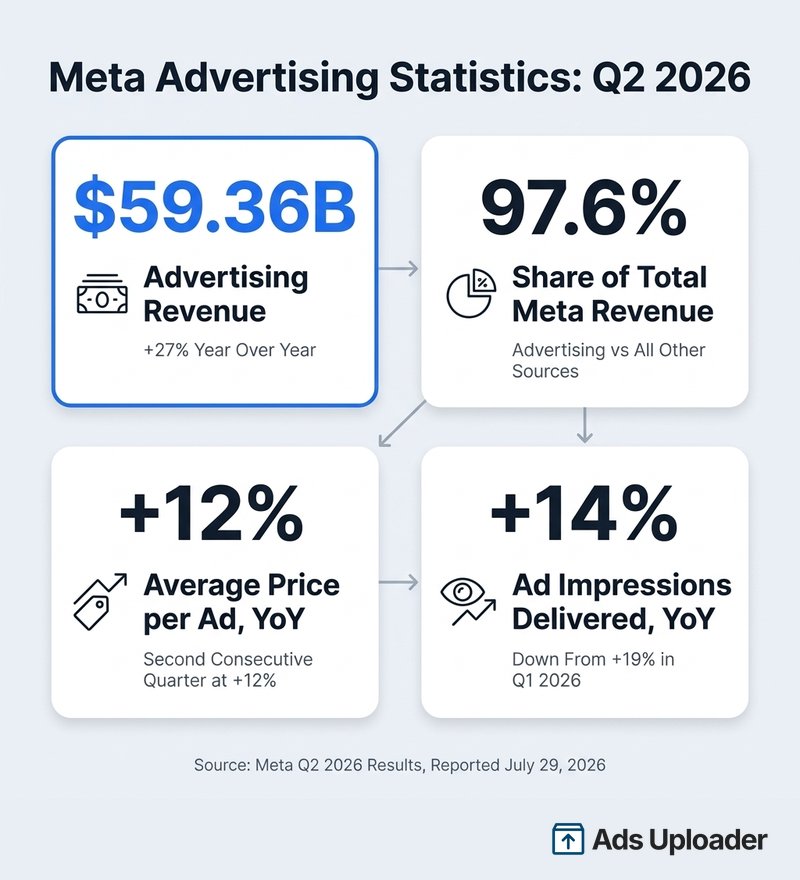
Meta ads statistics measure the scale, cost, and performance of paid advertising across Facebook, Instagram, Messenger, and WhatsApp. Meta reports the platform-level figures quarterly through investor releases and SEC filings, while cost benchmarks come from third-party providers measuring advertiser samples. In Q2 2026, Meta earned $59.36 billion from advertising, up 27% year over year, with average price per ad up 12% and impressions up 14%. Advertising accounts for roughly 97.6% of Meta revenue, making these figures the clearest read on where ad costs are heading.
Most Facebook ads statistics roundups are only fractionally about advertising. Go looking for Facebook advertising statistics and you will mostly find pages padded with organic engagement rates, Reels length benchmarks, Messenger demographics, and influencer platform preferences. Useful for a social media strategy deck, less so when you are defending a paid budget or benchmarking a CPM.
This page is paid Meta only. Every figure below carries a named source and the date it was measured, so you can tell at a glance whether it still holds. Financial and platform figures come from Meta's investor releases, earnings presentations, earnings-call transcripts, and SEC filings. Cost and performance benchmarks come from named third-party providers, with their sample size and methodology attached so you can judge whether their advertisers look anything like yours.
One scoping note before the numbers. Meta reports at the Family of Apps level, covering Facebook, Instagram, Messenger, and WhatsApp together. "Meta ad revenue" and "Facebook ad revenue" are not interchangeable, and Meta stopped publishing Facebook-only user metrics after 2023.
Meta Advertising Statistics at a Glance
If you only need one row, take it from here. These are the headline Meta ads statistics, all from Meta's Q2 2026 reporting on July 29, 2026.
| Metric | Latest value | Period | Source |
|---|---|---|---|
| Advertising revenue | $59.363 billion, up 27% YoY | Q2 2026 | Meta Q2 2026 results |
| Total revenue | $60.801 billion, up 28% YoY | Q2 2026 | Meta Q2 2026 results |
| Advertising share of total revenue | 97.62% | FY2025 | Calculated from Meta GAAP totals |
| Average price per ad | Up 12% YoY | Q2 2026 | Meta Q2 2026 results |
| Ad impressions delivered | Up 14% YoY | Q2 2026 | Meta Q2 2026 results |
| Family daily active people | 3.60 billion, up 3% YoY | June 2026 average | Meta Q2 2026 results |
| Capital expenditures | $31.078 billion | Q2 2026 | Meta Q2 2026 results |
| Advantage+ annualized run-rate | More than $75 billion | Q2 2026 | Meta Q2 2026 earnings call |
| Small businesses using an AI creative tool | 9 million | Q2 2026 | Meta Q2 2026 earnings call |
| Family average revenue per person | $16.86 | Q2 2026 | Meta Q2 2026 earnings presentation |
Advertising generated 97.62% of Meta's full-year 2025 revenue: $196.175 billion out of $200.966 billion (Meta FY2025 results).
Meta Platform Scale and Audience Statistics
These are the reach figures behind every campaign. They also contain the most commonly miscited number in this entire category.
Family and App-Level Reach
- Meta reported 3.60 billion Family daily active people, averaged across June 2026, up 3% year over year (Meta, Q2 2026 results).
- Family daily active people were 3.56 billion in March 2026, up 4% year over year (Meta, Q1 2026 results).
- Meta defines Family DAP as registered, logged-in people who visited at least one of Facebook, Instagram, Messenger, or WhatsApp on a given day. It relies on internal estimates of duplicate and false accounts, with roughly 3% measurement uncertainty disclosed in Meta's Q1 2026 Form 10-Q.
- Instagram passed 3 billion monthly active users, announced September 28, 2025 (Meta). This was a product milestone rather than a recurring audited investor metric.
- Instagram reached roughly 2 billion daily actives, cited on Meta's Q2 2026 earnings call. This was management commentary, not a standardised KPI.
The Last Official Facebook MAU Figure
Facebook's last reported monthly active user total was 3.07 billion, measured in December 2023, alongside 2.11 billion daily active users (Meta, Q4 and full-year 2023 results).
You will still see 3.07 billion quoted as if it were current, but it dates to December 2023. Beginning in Q1 2024, Meta stopped regularly publishing Facebook-only DAU and MAU, Facebook-only ARPU, and Family monthly active people, replacing them with Family DAP and Family ARPP, a change documented in Meta's 2023 Form 10-K. If you need a current Facebook-only user count, no official one exists.
The same caution applies to two other widely repeated numbers. Messenger's most recent clear Meta-stated total is 1.3 billion monthly active users from May 2018, and Facebook Stories' is 500 million daily users from May 2019. Both are too old to present as current.
Advertising Audience Composition
These are potential advertising reach estimates from Meta's campaign planning tools, analysed by Kepios and published by DataReportal in January 2025. They can include duplicate accounts and are not verified unique-person counts.
- Potential Facebook advertising reach: 2.28 billion accounts, up 93.3 million or 4.3% year over year.
- Reported adult gender split: 56.7% male, 43.3% female.
- Largest adult age bracket: 25 to 34, at 31.2% of the measured advertising audience.
- Largest single age and gender cell: men aged 25 to 34, at 18.5%.
| Country | Potential Facebook ad audience (January 2025) |
|---|---|
| India | 384 million |
| United States | 197 million |
| Indonesia | 122 million |
| Brazil | 112 million |
| Mexico | 93 million |
| Philippines | 90.8 million |
| Vietnam | 76.2 million |
| Bangladesh | 60 million |
| Thailand | 51 million |
| Pakistan | 49.4 million |
Two more audience figures worth carrying, both with clear provenance. Facebook users spent an average of 67 minutes per day in the Facebook Android app in August 2025 (Similarweb App Intelligence, via DataReportal's Digital 2026 Global Overview), a figure that excludes iOS and browser usage. And 78.6% of Facebook users also used Instagram, based on GWI's Q2 2025 survey of internet users aged 16 and over. That is self-reported survey overlap rather than deduplicated account data, and it describes the share of Facebook users on Instagram, not the reverse.
Audience composition is a starting point, not a strategy. For the fuller read on Meta's audience, including reach, demographics, and the reported-metric changes behind these numbers, see our Meta users statistics breakdown.
Meta reached 3.60 billion daily active people across its apps in June 2026, up 3% year over year (Meta, Q2 2026 results).
Meta Ad Revenue and Financial Statistics
All figures in this section come from Meta's investor releases and earnings presentations, tracked quarter by quarter in our Meta earnings for advertisers report.
| Metric | Q2 2026 | YoY | Q1 2026 | YoY |
|---|---|---|---|---|
| Advertising revenue | $59.363B | +27% | $55.024B | +33% |
| Total revenue | $60.801B | +28% | $56.311B | +33% |
| Operating income | $18.775B | -8% | $22.872B | +30% |
| Operating margin | 31% | Down from 43% | 41% | Down from 42% |
| Net income | $15.848B | -14% | $26.773B | +61% |
| Diluted EPS | $6.18 | -13% | $10.44 | +62% |
| Capital expenditures | $31.078B | Not presented as comparable YoY | $19.840B | Not presented as comparable YoY |
A caveat on the Q1 2026 growth rates: net income and EPS included an $8.03 billion tax benefit, worth $3.13 per diluted share. That inflates the headline percentages, so Q1 is not a clean operating comparison.
Full-year and half-year figures:
- FY2025 advertising revenue: $196.175 billion, up 22% (Meta, Q4 and full-year 2025 results).
- FY2025 total revenue: $200.966 billion, up 22%.
- FY2025 advertising share of revenue: 97.62%, calculated from those two figures. Meta does not report this percentage itself.
- H1 2026 advertising revenue: $114.387 billion, calculated from Q1 and Q2 reported results.
Advertising Revenue by User Geography
Meta assigns this revenue based on its estimate of where the user was located when the ad was delivered, not the advertiser's billing address.
| User geography | Q2 2026 ad revenue | Q1 2026 ad revenue |
|---|---|---|
| United States and Canada | $26.337B | $23.667B |
| Europe | $14.085B | $13.296B |
| Asia-Pacific | $10.847B | $10.631B |
| Rest of World | $8.094B | $7.430B |
| Worldwide | $59.363B | $55.024B |
Two supporting metrics. Family average revenue per person was $16.86 in Q2 2026, up from $15.66 in Q1 2026. Meta calculates ARPP as Family of Apps revenue divided by the average of daily active people at the start and end of the quarter, so it is not advertiser spend and not revenue per advertiser.
Capital Expenditure
- Q2 2026 capex: $31.078 billion, including principal payments on finance leases.
- FY2026 capex guidance after Q2: $130 billion to $145 billion.
- FY2026 total expense guidance: $165 billion to $169 billion.
Capex covers servers, data centers, and networking. Meta does not break out an AI-only figure, and it has never described this spending as something advertisers repay through higher CPMs. Its own explanation for Q2 price growth pointed elsewhere, which the next section covers.
You can read the full details in Meta's Q2 2026 results release.
Meta guided to $130 billion to $145 billion of capital expenditure for 2026, against $196.175 billion of advertising revenue for all of 2025 (Meta, Q2 2026 and FY2025 results).
Meta Ad Pricing Statistics: Price per Ad and Impressions
Start with the definition, because this metric measures something more specific than it sounds.
Per Meta's Q1 2026 Form 10-Q, average price per ad is total advertising revenue divided by the number of ads delivered, and impressions "are considered delivered when an ad is displayed to a user." The metric covers every delivered ad regardless of whether the advertiser optimized for impressions, clicks, conversions, or app events.
That makes it a platform-wide monetization measure, not a CPM. An advertiser's CPM is their own spend divided by their own impressions, multiplied by 1,000. Meta's figure blends every country, placement, objective, billing event, auction, and surface on the platform. A 12% rise in Meta's average price per ad does not mean your CPM rose 12%.
Worldwide Quarterly Series
| Quarter | Ad impressions YoY | Average price per ad YoY |
|---|---|---|
| Q1 2025 | +5% | +10% |
| Q2 2025 | +11% | +9% |
| Q3 2025 | +14% | +10% |
| Q4 2025 | +18% | +6% |
| Q1 2026 | +19% | +12% |
| Q2 2026 | +14% | +12% |
Launch More. Click Less.
Upload hundreds of creatives at once, auto-match thumbnails to videos, and export directly to Meta Ads Manager.
Try Ads Uploader FreeNo credit card required • 7-day free trial
The Regional Split
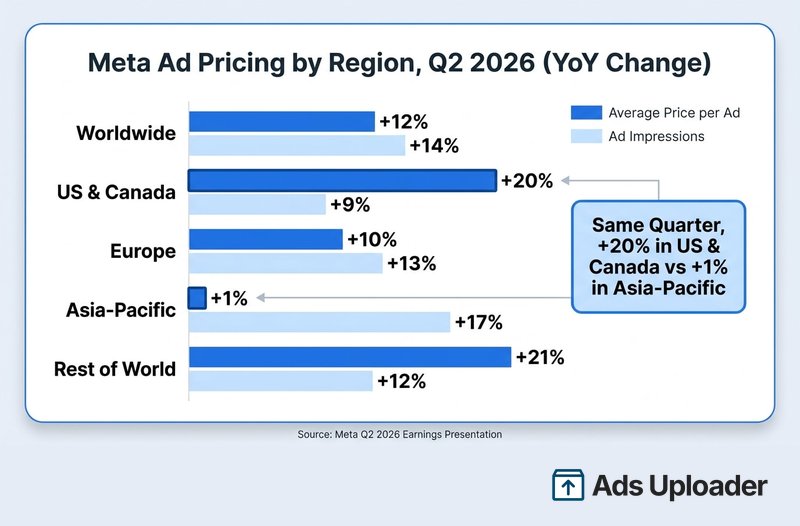
The worldwide average flattens a wide regional spread. All figures from Meta's Q1 and Q2 2026 earnings presentations.
| Geography | Q1 2026 impressions | Q1 2026 price/ad | Q2 2026 impressions | Q2 2026 price/ad |
|---|---|---|---|---|
| United States and Canada | +13% | +14% | +13% | +20% |
| Europe | +17% | +19% | +13% | +10% |
| Asia-Pacific | +23% | +5% | +17% | +1% |
| Rest of World | +17% | +18% | +12% | +21% |
| Worldwide | +19% | +12% | +14% | +12% |
The single worldwide figure of +12% in Q2 2026 contained a spread running from +1% in Asia-Pacific to +21% in Rest of World, with US and Canada at +20%. If you buy media in one market, your regional line is the one that matters, not the worldwide blend.
Meta attributed the Q2 price increase to advertising performance gains, a more favorable macroeconomic environment than Q2 2025, and foreign-exchange tailwinds, partly offset by faster impression growth on lower-monetizing surfaces and regions. It attributed the 14% impression growth to engagement growth, user growth, and ad-load optimization. Both are company explanations rather than independently verified causes.
For the platform changes driving these shifts quarter to quarter, we maintain a running log of Meta Ads updates.
In Q2 2026, Meta's average price per ad rose 20% in US & Canada and 1% in Asia-Pacific, inside the same worldwide 12% figure (Meta, Q2 2026 earnings presentation).
Facebook and Meta Ads Cost Benchmarks: CPM, CPC, and CPL
Everything in this section comes from third-party providers measuring their own advertiser samples. None of it is a Meta figure. Read each one alongside its sample, because objective, country, vertical mix, and aggregation method routinely move these numbers by 2x or more. For turning benchmarks like these into a working budget, see our Facebook ads cost guide.
LocaliQ and WordStream, 2025 Facebook Advertising Benchmarks
US campaigns, April 1 2024 to June 30 2025, reported as medians. Traffic figures cover 554 campaigns, leads figures cover 726 campaigns. This remained the most recent Facebook edition as of August 2026.
| Campaign type | CTR | CPC | Conversion rate | Cost per lead |
|---|---|---|---|---|
| Traffic | 1.71% | $0.70 | Not reported | Not reported |
| Leads | 2.59% | $1.92 | 7.72% | $27.66 |
Across traffic campaigns in the same report, CTR ranged from 0.80% for automotive repair to 4.13% for shopping, collectibles, and gifts, while CPC ranged from $0.34 to $1.22.
Triple Whale, Facebook Ad Benchmarks by Industry
Roughly 35,000 ecommerce brands, January 1 to December 31 2025, Facebook and Instagram combined, reported as medians. Updated April 7, 2026.
| Metric | 2025 median |
|---|---|
| CPM | $13.48 |
| CTR | 2.19% |
| Conversion rate | 1.57% |
| CPA | $38.17 |
| ROAS | 1.93 |
Vertical spread in the same dataset: CPM ran from $10.01 for Automotive to $20.70 for Health and Wellness, CTR from 1.85% for Food and Beverage to 2.70% for Health and Wellness, and ROAS from 1.17 for Media and Publishing to 2.54 for Automotive. Geography and attribution window are not disclosed.
Leads Campaign Benchmarks by Industry
Medians from the LocaliQ and WordStream US sample, April 2024 to June 2025. Note that median CPC divided by median conversion rate will not reconcile to median CPL, because each column is calculated independently.
| Industry | CTR | CPC | CVR | CPL |
|---|---|---|---|---|
| Arts and entertainment | 3.92% | $1.08 | 9.34% | $18.17 |
| Attorneys and legal services | 2.11% | $4.10 | 10.53% | $18.17 |
| Beauty and personal care | 2.55% | $3.06 | 5.29% | $51.42 |
| Career and employment | 2.81% | $0.86 | 5.77% | $17.64 |
| Dentists | 1.05% | $9.78 | 6.38% | $76.71 |
| Education and instruction | 1.86% | $1.65 | 10.08% | $28.22 |
| Furniture | 1.48% | $2.18 | 3.77% | $40.04 |
| Health and fitness | 1.72% | $2.64 | 5.63% | $52.98 |
| Home and home improvement | 1.94% | $2.23 | 5.22% | $41.26 |
| Industrial and commercial | 2.08% | $1.80 | 9.34% | $37.34 |
| Personal services | 1.99% | $2.08 | 6.51% | $30.57 |
| Physicians and surgeons | 3.02% | $2.23 | 4.51% | $47.47 |
| Real estate | 3.75% | $1.57 | 9.53% | $16.61 |
| Restaurants and food | 2.97% | $0.74 | 18.25% | $3.16 |
| Sports and recreation | 3.41% | $1.07 | 5.48% | $19.30 |
CPM by Objective
Affect Performance Team published modeled US CPM ranges for Q1 2026, covering Facebook and Instagram combined. These are editorially calibrated ranges built from roughly 90% internal client data and 10% external market data rather than a raw median, so treat them as directional.
| Objective | Q1 2026 US CPM range |
|---|---|
| Reach and impressions | $9 to $14 |
| Traffic and engagement | $10 to $15 |
| Sales | $14 to $25 |
| Website lead generation | $26 to $40 |
A caution on three sources. Revealbot's cost benchmarks now redirect to Bïrch, whose charts render dynamically rather than as fixed, dated values. Statista's country-level CPM series identifies February 2025 as its measurement period but keeps the values and methodology behind a paywall. EMARKETER's Meta CPM growth series is subscription-gated. If you see a current CPM figure attributed to any of these providers on an aggregator blog, trace it to a dated export before citing it.
Meta CPM runs roughly $9 to $40 by objective and $10.01 to $20.70 by vertical (Affect, Q1 2026 US ranges; Triple Whale, 2025 ecommerce).
Meta Ads CTR, Conversion, and Ranking Statistics
Third-party CTR and conversion benchmarks appear in the tables above, and our Facebook ads CTR guide breaks them down by placement and industry. This section covers what Meta itself has published about the systems producing those outcomes.
Meta reported these results on its Q1 and Q2 2026 earnings calls. Each describes an aggregate platform or model measurement, not a guaranteed lift for any individual account.
| System or change | Meta-reported result | Period |
|---|---|---|
| GEM plus user-understanding models | 8.3% increase in ad clicks, 15.7% conversion uplift on Facebook | Q2 2026 |
| Meta Generative Recommender early pilots | 1% increase in app-event conversions on Instagram | Q2 2026 |
| Lattice and GEM models | More than 6% conversion-rate increase for landing-page-view ads | Q1 2026 |
| Adaptive Ranking on offsite conversions | 1.6% conversion-rate increase across major Facebook and Instagram surfaces | Q1 2026 |
| AI video generation | More than 3% higher conversion rates in tests | Q1 2026 |
The retrieval engine underneath much of this is Andromeda. Meta Engineering's December 2024 report disclosed a 10,000x increase in model capacity, more than 100x improvement in feature-extraction latency and throughput, more than 3x increase in queries per second, a 10x inference-efficiency improvement, a 6% increase in retrieval recall, and an 8% improvement in ad quality for selected segments.
The same report added three advertiser-facing figures from 2024: more than 1 million advertisers created over 15 million ads using Meta's generative AI tools in a single month, advertisers using image generation saw an estimated 7% conversion increase, and advertisers newly enabling eligible Advantage+ creative AI features saw a 22% ROAS increase. These are Meta-measured 2024 results and should be dated as such.
What this means practically is that creative volume and diversity now carry more weight than manual targeting precision, which we unpack in our breakdown of Meta Andromeda.
Meta credited new user-understanding models plus GEM ranking with an 8.3% increase in ad clicks and a 15.7% conversion uplift on Facebook in Q2 2026 (Meta, Q2 2026 earnings call).
Meta AI and Automation Adoption Statistics
This is the fastest-moving cluster of numbers on the platform, and the one most absent from other statistics roundups.
| Metric | Figure | Period | Scope |
|---|---|---|---|
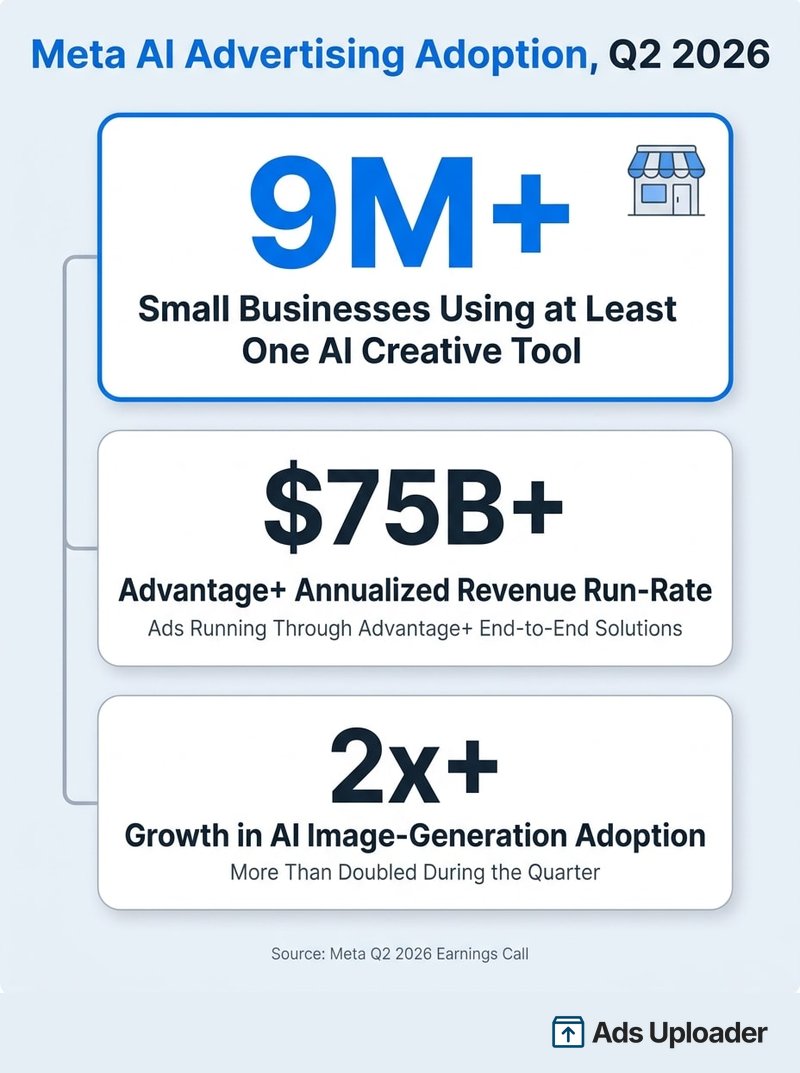
| Small businesses using at least one AI ad creative tool | 9 million | Q2 2026 | Meta-stated adoption count |
| Advertisers using at least one generative AI creative tool | More than 8 million | Q1 2026 | Different denominator from the Q2 figure |
| AI image-generation adoption | More than doubled during the quarter | Q2 2026 | No absolute baseline given |
| Advantage+ end-to-end solutions | More than $75 billion annual revenue run-rate | Q2 2026 | Revenue associated with ads using the products |
| Value Optimization suite | More than $20 billion annual run-rate, more than 2x YoY | Q1 2026 | Revenue associated with the suite |
| Partnership ads | $10 billion annual run-rate, more than 2x YoY | Q1 2026 | Revenue associated with partnership ads |
Two precision points that matter if you plan to quote these. The Q1 figure counts advertisers and the Q2 figure counts small businesses, so they are not a clean sequential series. And the Advantage+ run-rate measures advertising revenue flowing through those products. It is not subscription revenue, not incremental revenue caused by Advantage+, and not a measure of advertiser savings or ROAS.
Meta's full commentary is in the Q2 2026 earnings-call transcript.
Meta's Advantage+ end-to-end solutions passed a $75 billion annualized revenue run-rate in Q2 2026 (Meta, Q2 2026 earnings call).
Meta Ad Transparency and Ad Library Statistics
- Political, election, and social-issue ads are retained for 7 years, active and inactive (Meta Help, About the Ad Library).
- Ads shown in the EU under the Digital Services Act are archived for 1 year (Meta, August 2023).
- Standard commercial ads outside those archives are searchable only while active. There is no general seven-year archive for ordinary inactive commercial ads.
- Meta removed more than 5.1 million ads on Facebook and Instagram in the EU during H2 2024, including more than 87,000 for misinformation-related violations, per its EU Code of Practice on Disinformation submission. This is EU-only, covers six months, and counts policy-enforcement removals rather than all pre-delivery rejections.
One caution on totals. Meta's Ad Library Report publishes a cumulative ad count, but the figure is scoped to the country and date range selected in the report, so the same page returns very different totals depending on the view. We checked it twice on August 1, 2026 and got two figures an order of magnitude apart. Treat any cumulative Ad Library number you see quoted without a stated geography and date as unusable, and read the report live instead. For what the library does and does not expose about competitors, see our guide to the Meta Ads Library.
Political and social-issue ads stay in the Ad Library for seven years; ordinary commercial ads are searchable only while they are running (Meta Ad Library policy).
How to Cite These Meta Advertising Statistics
Facebook ads statistics travel badly. They get lifted into decks and articles, lose their date, and then circulate for years after they stop being true. A few conventions keep a figure accurate after it leaves this page.
- Cite the primary source, not this page, for Meta financial figures. Investor release URLs are stable and reviewers can verify them.
- Carry the as-of date every time. "Average price per ad up 12%" only means something with "in Q2 2026" attached.
- Do not convert Meta's average price per ad into a CPM claim. They measure different things, as covered above.
- Name the benchmark provider and its sample when quoting CPM, CPC, or CTR. "Median CPM of $13.48 across roughly 35,000 ecommerce brands in 2025, per Triple Whale" survives scrutiny in a way that "average Facebook CPM is $13.48" does not.
- Distinguish Meta from Facebook. Meta reports Family of Apps results, so Facebook-only figures generally do not exist after 2023.
- Label modeled figures as modeled. Potential reach estimates and calibrated CPM ranges are not measured counts.
Frequently Asked Questions
Save Hours on Creative Testing
Stop uploading ads one by one. Bulk process unlimited creatives with automatic media matching and direct API publishing.
Try Ads Uploader FreeNo credit card required • 7-day free trial
How Much Money Does Meta Make From Advertising?
Meta generated $59.363 billion in advertising revenue in Q2 2026, up 27% year over year. For full-year 2025 the figure was $196.175 billion, up 22%. First-half 2026 advertising revenue was $114.387 billion.
What Percentage of Meta's Revenue Comes From Advertising?
97.62% in full-year 2025, calculated from $196.175 billion of advertising revenue against $200.966 billion total. Q2 2026 was roughly the same at 97.6%. Meta does not publish this percentage itself.
What Is the Average CPM for Facebook Ads?
There is no universal figure. Triple Whale reported a $13.48 median across roughly 35,000 ecommerce brands for 2025, with vertical medians from $10.01 to $20.70. Affect's modeled Q1 2026 US ranges ran from $9 to $14 for reach up to $26 to $40 for website lead generation.
What Is a Good CTR for Facebook Ads?
Compare against your objective. LocaliQ and WordStream reported US medians of 1.71% for traffic campaigns and 2.59% for leads campaigns across April 2024 to June 2025. Triple Whale's 2025 ecommerce median was 2.19%.
Are Meta Ad Costs Going Up in 2026?
Meta's average price per ad rose 12% in both Q1 and Q2 2026. That is aggregate monetization per delivered ad rather than a universal advertiser CPM increase, and the Q2 regional spread ran from +1% to +21%.
How Many Advertisers Run Ads on Meta?
More than 10 million active advertisers, first disclosed in Meta's Q3 2020 prepared remarks and reiterated in November 2022. No newer official total has been published.
How Many People Can Meta Ads Reach?
Meta reported 3.60 billion Family daily active people in June 2026. Facebook's potential advertising audience was around 2.28 billion accounts in January 2025 per Kepios analysis of Meta planning data. Do not add potential reach across apps, as the estimates include duplicates.
How Much Is Meta Spending on AI Infrastructure?
Meta guided to $130 billion to $145 billion of 2026 capital expenditure and spent $31.078 billion in Q2 2026 alone. It covers servers, data centers, and networking rather than an AI-only total, and Meta has not described it as a pass-through to advertiser CPMs.
Does Meta Still Report Facebook User Numbers?
No. Meta stopped regularly publishing Facebook-only DAU and MAU, Facebook-only ARPU, and Family monthly active people from Q1 2024, keeping Family DAP and Family ARPP instead. The last Facebook MAU figure was 3.07 billion in December 2023.
Where Do Meta's Official Advertising Statistics Come From?
Quarterly investor releases carry revenue, impressions, and price-per-ad growth. Earnings presentations add regional splits and ARPP. SEC Forms 10-Q and 10-K carry definitions and methodology. Earnings calls provide adoption figures and revenue run-rates.
Key Takeaways
Four things worth holding onto from this data.
Revenue and pricing are both climbing, but not evenly. Meta's advertising revenue grew 27% year over year in Q2 2026 while average price per ad rose 12% for the second consecutive quarter. Impression growth slowed from 19% to 14% over the same stretch.
The regional split matters more than the worldwide average. A single 12% figure contained a 20-point spread across geographies in Q2 2026. If you buy in one market, that market's number is the one to track.
Third-party benchmarks are directional, not targets. CPM figures range from $9 to $40 depending on objective and from $10.01 to $20.70 depending on vertical. Compare against a sample that resembles your account, and always carry the provider name and date.
AI adoption is the fastest-moving number on the platform. Nine million small businesses now use at least one Meta AI creative tool, and Advantage+ has passed a $75 billion annualized run-rate.
Meta reports quarterly, so these Meta ads statistics have a predictable refresh cycle: late January, late April, late July, and late October. This page updates after each release. If you are citing any figure here in your own work, take the source and the date with it, and it will still be defensible when someone checks.