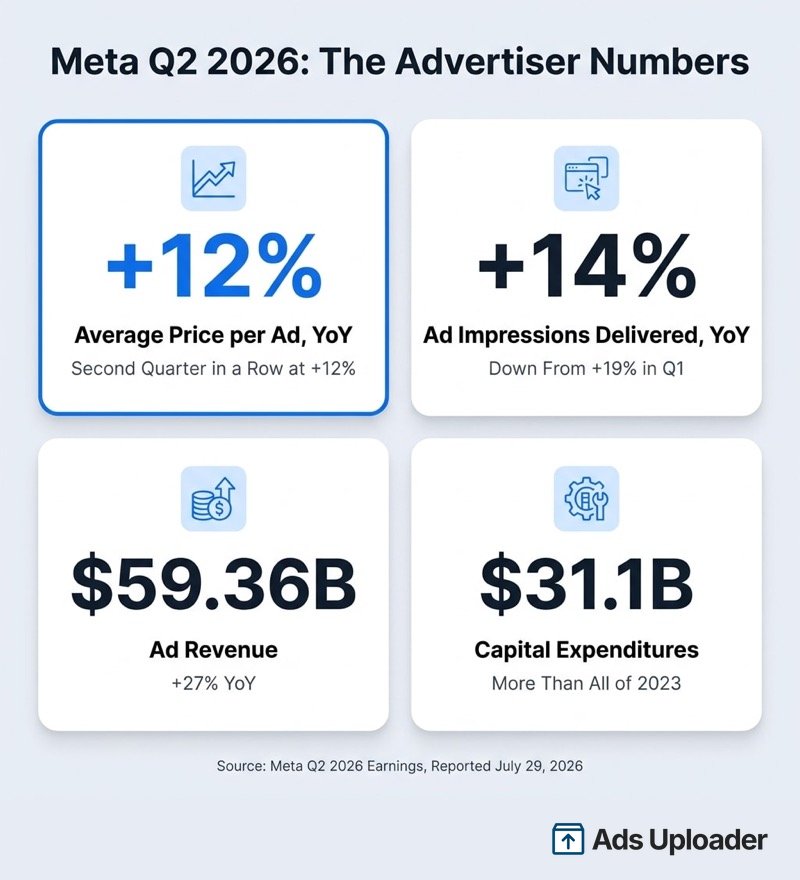
Meta earnings for Q2 2026 were released on July 29, 2026, after US market close. Revenue was $60.801 billion, up 28% year over year, advertising revenue was $59.363 billion, up 27%, and diluted EPS was $6.18. The advertiser-facing metrics sit further down the release: average price per ad rose 12% year over year and ad impressions delivered grew 14%. Rising prices alongside decelerating impression growth set the direction of auction costs, which is why the release matters to media buyers as well as shareholders.
Your CPMs are up double digits. You have spent a week tearing the account apart looking for what you broke: frequency, creative fatigue, audience overlap, a bad exclusion. Sometimes it really is one of those. Sometimes the answer is sitting in Meta's own quarterly earnings release, and it takes five minutes to check.
Four times a year, Meta publishes what its auction is actually charging. It sits in the earnings release, wedged between numbers written for people who own the stock, under a heading called "average price per ad." It rose 12% year over year in Q2 2026. It rose 12% in Q1 2026 too. Ad impressions delivered, the supply side of the same auction, grew 14% after growing 19% the quarter before.
Earnings coverage is usually written for people who own the stock, which is fair, that is its job. This page reads the same release for people who buy the ads: the buyer-side metrics tracked every quarter back to Q1 2022, with Meta's own definitions and the caveats that stop you misreading them.
It gets updated within days of each earnings call.
The Q2 2026 Meta Earnings Numbers Advertisers Actually Need
Meta reported second-quarter 2026 results after market close on July 29, 2026.
| Metric | Q2 2026 | vs Q2 2025 |
|---|---|---|
| Average price per ad | +12% YoY | +9% a year earlier |
| Ad impressions delivered | +14% YoY | +11% a year earlier |
| Advertising revenue | $59.363B | +27% |
| Total revenue | $60.801B | +28% |
| Operating income | $18.775B | -8% |
| Operating margin | 31% | 43% a year earlier |
| Net income | $15.848B | -14% |
| Diluted EPS | $6.18 | -13% |
| Capital expenditures | $31.08B | $17.01B a year earlier |
| FY2026 expense guidance | $165-169B | lower end raised |
| FY2026 capex guidance | $130-145B | narrowed from $125-145B |
Source: Meta's Q2 2026 results release.
The profit line is where the market flinched. Diluted EPS of $6.18 came in under a FactSet analyst consensus of roughly $7.14 (that consensus figure comes from press coverage, not from Meta). Costs and expenses included $2.40 billion of charges related to legal proceedings and $1.18 billion of severance tied to the May 2026 headcount reduction. CFO Susan Li said that excluding those two items, operating income would have risen 9% year over year rather than falling 8%.
For an advertiser, none of that changes the auction. Two lines do.
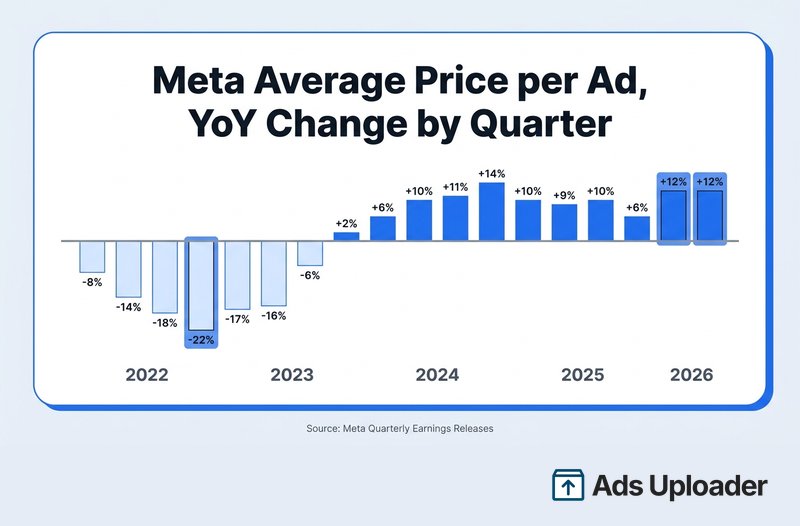
The first is the streak. 12% in Q1 2026, 12% again in Q2 2026. In the four-year series below, that is the first time price growth has held at 12% or higher for two straight quarters.
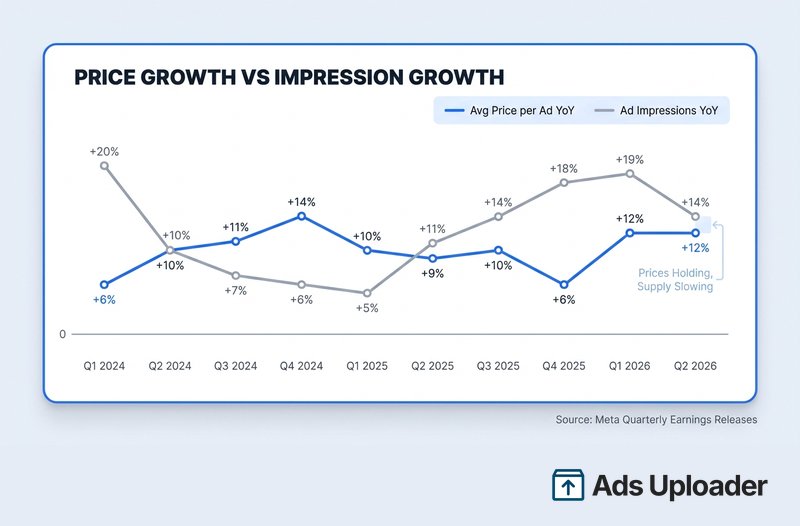
The second is the gap between price and supply. Impression growth fell five points sequentially, from 19% to 14%, while price growth held flat. More money chasing less new inventory. That is what a tightening auction looks like at platform level, well before it shows up as a line in your Ads Manager.
When Is the Next Meta Earnings Call
Meta reported Q2 2026 on July 29, 2026, after market close. As of August 1, 2026, Meta had not officially announced its Q3 2026 date.
The cadence is consistent enough to plan around:
- Q3 2023: reported October 25, 2023
- Q3 2024: reported October 30, 2024
- Q3 2025: reported October 29, 2025
- Q3 2026: not yet announced, late October 2026 estimated
Treat that estimate as an estimate until the official advisory posts on Meta's investor relations site, which is also where the webcast lives. Meta reports after US market close and hosts the call the same day, with the press release going out ahead of it. That release is where your numbers are, so you can skip the call and still get everything that affects your media plan.
You do not need to read the whole release either. Five minutes gets you what matters:
- Average price per ad, worldwide YoY. One line in the release. This is the auction direction.
- Ad impressions delivered, worldwide YoY. The supply side. Compare the gap between the two.
- The regional slides in the earnings presentation. Find your buying geography. In Q2 2026 the difference between the worldwide blend and US & Canada was eight percentage points.
- Capex and expense guidance. Not because it bills you, but because it tells you how hard Meta is pushing on ad performance next year.
- The CFO's explanation of the price change. Meta always attributes it. Performance, macro, and currency are the recurring three.
This page gets a new row in every table below within days of each call. For the platform changes that land between earnings dates, the Meta Ads updates page covers those twice a month.
Meta Average Price per Ad, Quarter by Quarter
Meta publishes these numbers one quarter at a time, so the running picture sits scattered across 18 separate press releases. Here is the whole series in one place, and it gains a row every quarter.
| Quarter | Avg. price/ad YoY | Ad impressions YoY | Advertising revenue | Total revenue | Quarterly capex | Operating margin | FY capex guidance given with results |
|---|---|---|---|---|---|---|---|
| Q1 2022 | -8% | +15% | $27.00B | $27.91B, +7% | $5.55B | 31% | FY22: $29-34B |
| Q2 2022 | -14% | +15% | $28.15B, -2% | $28.82B, -1% | $7.75B | 29% | FY22: $30-34B |
| Q3 2022 | -18% | +17% | $27.24B, -4% | $27.71B, -4% | $9.52B | 20% | FY22: $32-33B |
| Q4 2022 | -22% | +23% | $31.25B, -4% | $32.17B, -4% | $9.22B | 20% | FY23: $30-33B |
| Q1 2023 | -17% | +26% | $28.10B, +4% | $28.65B, +3% | $7.09B | 25% | FY23: $30-33B |
| Q2 2023 | -16% | +34% | $31.50B, +12% | $32.00B, +11% | $6.35B | 29% | FY23: $27-30B |
| Q3 2023 | -6% | +31% | $33.64B, +24% | $34.15B, +23% | $6.76B | 40% | FY23: $27-29B |
| Q4 2023 | +2% | +21% | $38.71B, +24% | $40.11B, +25% | $7.90B | 41% | FY24: $30-37B |
| Q1 2024 | +6% | +20% | $35.64B, +27% | $36.46B, +27% | $6.72B | 38% | FY24: $35-40B |
| Q2 2024 | +10% | +10% | $38.33B, +22% | $39.07B, +22% | $8.47B | 38% | FY24: $37-40B |
| Q3 2024 | +11% | +7% | $39.89B, +19% | $40.59B, +19% | $9.20B | 43% | FY24: $38-40B |
| Q4 2024 | +14% | +6% | $46.78B, +21% | $48.39B, +21% | $14.84B | 48% | FY25: $60-65B |
| Q1 2025 | +10% | +5% | $41.39B, +16% | $42.31B, +16% | $13.69B | 41% | FY25: $64-72B |
| Q2 2025 | +9% | +11% | $46.56B, +21% | $47.52B, +22% | $17.01B | 43% | FY25: $66-72B |
| Q3 2025 | +10% | +14% | $50.08B, +26% | $51.24B, +26% | $19.37B | 40% | FY25: $70-72B |
| Q4 2025 | +6% | +18% | $58.14B, +24% | $59.89B, +24% | $22.14B | 41% | FY26: $115-135B |
| Q1 2026 | +12% | +19% | $55.02B, +33% | $56.31B, +33% | $19.84B | 41% | FY26: $125-145B |
| Q2 2026 | +12% | +14% | $59.36B, +27% | $60.80B, +28% | $31.08B | 31% | FY26: $130-145B |
Source: Meta quarterly earnings releases. Price per ad and impressions are worldwide year-over-year changes for the Family of Apps as stated in each release. Capex includes principal payments on finance leases, matching Meta's headline definition. Full-year capex guidance is the range in effect when that quarter was reported, which is why the guidance year rolls forward at Q4.
What "Average Price per Ad" Actually Measures
Meta's own definition, from its SEC filings, is one sentence: average price per ad is total advertising revenue divided by the number of ads delivered. The longer version in the revenue notes adds the part that matters most: it represents the average price paid per ad by a marketer "regardless of their desired objective such as impression or action."
So it counts everything. A $0.004 Reels impression in Indonesia and a $40 lead in US home services land in the same numerator and the same denominator. The metric covers the Family of Apps: Facebook, Instagram, Messenger, WhatsApp, and related services.
Why It Is Not Your CPM
Your CPM is your spend divided by the impressions you bought, times 1,000. Meta's number is its total ad revenue divided by every ad it delivered to anyone, anywhere, on any objective. Different fractions, different denominators, and they are easy to conflate, so it is worth keeping the two separate when you read the headlines.
The blend moves for reasons that have nothing to do with your account:
- region and currency mix
- placement and surface mix (Reels and video monetize at lower rates than Feed and Stories)
- campaign objective mix, since action-priced ads sit in the same average as impression-priced ones
- auction demand and competitor bidding
- predicted action rates and ad relevance
- growth of lower-monetizing versus higher-monetizing inventory
Meta says as much in its filings: the number of ads shown is subject to methodological change, and Meta raises or lowers ad load as part of product and monetization strategy. So a 12% increase in Meta's average price per ad does not mean your CPM rose 12%. It means the platform's realized revenue per delivered ad rose 12%. That is a direction, not a forecast for your account.
From -22% to +12%: The Four-Year Arc
Read the table top to bottom and four distinct regimes fall out.
2022 was the crash. Four consecutive quarters of falling prices, bottoming at -22% in Q4 2022, while impressions grew 15% to 23%. Post-ATT signal loss plus a soft macro market: Meta had the inventory and could not price it.
2023 was the repair year. Declines shrank quarter by quarter (-17%, -16%, -6%) and turned positive at +2% in Q4 2023, on impression growth as high as 34% as Reels inventory scaled.
2024 was the re-acceleration. Prices went +6%, +10%, +11%, +14% while impression growth collapsed from 20% to 6%. That combination is the clearest "auction got tighter" signal in the whole series.
2025 into 2026 is the current regime. Prices ran +10%, +9%, +10%, +6%, then jumped to +12% in Q1 2026 and held at +12% in Q2 2026. Impression growth came back (18%, 19%) and then eased to 14%.
Where the Price Increases Are Landing: Regional Splits
The worldwide number is an average of markets that behave nothing alike. Meta splits price and impressions by user geography in its quarterly earnings presentation (apportioned by where it estimates the user was when the impression was delivered, not by the advertiser's billing address). If you buy US inventory, the blend is not your number.
Average price per ad, YoY change by user geography:
| Quarter | Worldwide | US & Canada | Europe | Asia-Pacific | Rest of World |
|---|---|---|---|---|---|
| Q4 2024 | +14% | +12% | +16% | +12% | +23% |
| Q1 2025 | +10% | +14% | +9% | +3% | +17% |
| Q2 2025 | +9% | +11% | +17% | +2% | +15% |
| Q3 2025 | +10% | +13% | +19% | +1% | +20% |
| Q4 2025 | +6% | +9% | +12% | -2% | +15% |
| Q1 2026 | +12% | +14% | +19% | +5% | +18% |
| Q2 2026 | +12% | +20% | +10% | +1% | +21% |
Ad impressions delivered, YoY change by user geography:
| Quarter | Worldwide | US & Canada | Europe | Asia-Pacific | Rest of World |
|---|---|---|---|---|---|
| Q4 2024 | +6% | +6% | +5% | +10% | +3% |
| Q1 2025 | +5% | +4% | +5% | +9% | +1% |
| Q2 2025 | +11% | +9% | +6% | +16% | +7% |
| Q3 2025 | +14% | +8% | +9% | +23% | +9% |
| Q4 2025 | +18% | +13% | +13% | +24% | +14% |
| Q1 2026 | +19% | +13% | +17% | +23% | +17% |
| Q2 2026 | +14% | +9% | +13% | +17% | +12% |
Source: Meta's Q2 2026 earnings presentation and the equivalent slides in prior quarters.
Here is the line that should change how a US advertiser reads the headline. In Q2 2026, price per ad in US & Canada rose 20% while the worldwide number printed 12%, and US & Canada impression growth was the slowest of any region at 9%. Prices up 20%, supply up 9% is a materially tighter market than "+12% worldwide" suggests.
The blend gets diluted at the other end by Asia-Pacific, where price rose 1% on 17% more impressions. Every cheap impression Meta adds in a low-priced market drags the worldwide average down while doing nothing at all for your US CPMs. So if you buy in North America and your costs jumped harder than 12% this quarter, you are not imagining it. The official data says that is the market, not your account.
Launch More. Click Less.
Upload hundreds of creatives at once, auto-match thumbnails to videos, and export directly to Meta Ads Manager.
Try Ads Uploader FreeNo credit card required • 7-day free trial
Ad Impressions Growth Is Slowing
Impression growth is the supply side, and it is the number most people ignore.
Worldwide impressions grew 14% in Q2 2026 after 19% in Q1. Meta gave no single explicit reason for the five-point deceleration. Li said growth was healthy across all regions, driven by engagement growth, user growth, and ad load optimizations. Context sits nearby: Family daily active people grew 3% year over year in Q2, down from 4% in Q1, and Q1 had been depressed by internet disruptions in Iran and WhatsApp restrictions in Russia, with Iranian access largely restored during Q2. (Anything past that is analysis, ours included, not Meta's explanation.)
What matters operationally is the shape of the two lines together. When impressions grow much faster than prices, as in 2022 and 2023, advertisers get more inventory at falling cost. When prices grow while impression growth decelerates, as in 2024 and now again in 2026, the same budget buys progressively less reach.
Q2 2026 is the second pattern, and regionally it is sharper still: US & Canada at +20% price on +9% impressions. Plan budgets accordingly. If you are modeling next quarter's reach on this quarter's CPMs while Meta's own series says realized prices are compounding at low double digits, your reach forecast is optimistic before you write a single ad.
Ad Revenue, Capex, and Margins: Who Pays for the Data Centers
Advertising was $59.363 billion of Meta's $60.801 billion in Q2 2026 revenue, or 97.6%. The full-year 2025 ratio was identical. Meta is an advertising company with expensive side projects, and every strategic decision it makes gets paid for out of the auction you bid in.
Those side projects got expensive fast. Capex, including principal payments on finance leases, ran $32.04 billion for all of 2022, $28.10 billion in 2023, $39.23 billion in 2024, and $72.2 billion in 2025. Meta now guides to $130-145 billion for 2026. The single quarter of Q2 2026, at $31.08 billion, is larger than the whole of 2023.
It lands in the margin. Operating margin was 43% in Q2 2025 and 31% in Q2 2026, though roughly half that compression came from the legal charges and severance rather than infrastructure. Free cash flow was $784 million on nearly $61 billion of revenue.
One thing worth being precise about: no line in Meta's filings connects capex to advertiser CPMs, and nobody is billing you for a GPU. Meta does not divide its data center spend by its advertisers and lift clearing prices to cover it. The auction sets prices from demand.
The connection, if you want to draw one, is indirect and runs through performance: infrastructure funds the ranking and creative models, better models improve measured outcomes, better outcomes make advertisers willing to pay more per result, and higher willingness to pay lifts clearing prices. Meta's stated reasons for the Q2 price increase were ad performance gains, improved macro conditions versus Q2 2025, and currency tailwinds. Note the first item. Performance gains are the bridge between the capex line and your cost line (our read, not Meta's claim).
Practically, Meta is spending at a level that only makes sense if ad performance keeps improving enough to pull more demand into the auction. If it works, your results per dollar improve and so does everyone else's bid. If it does not, the pressure moves to ad load. Neither path ends with cheaper impressions.
What This Means for Your CPMs
Gil David, founder of the agency Run DMG, summed up the Q2 report for advertisers on LinkedIn: "You're shopping in the same store but the price of bread sneaked up."
That is the right frame. Nothing about your account changed. The clearing price did.
Two independent lines now point the same way. Meta's official series says realized price per delivered ad rose 12% worldwide and 20% in US & Canada in Q2 2026. Separately, Triple Whale's 2025 Meta benchmarks, drawn from nearly 35,000 brands, put median Meta CPM at $14.19 for the year, up 20.03% versus 2024, with every industry vertical in their sample showing higher CPMs.
Corroboration, not confirmation. A panel median CPM from a particular mix of ecommerce brands, countries, and objectives is not the same animal as a global revenue-per-delivered-ad average across everything Meta serves, and the two will never match. What is useful is that an independent panel of real accounts moved the same direction, at a similar order of magnitude, as the official disclosure. For the full set of third-party CPM, CPC, and CTR benchmarks alongside Meta's own figures, see our Meta ads statistics.
Auction-Level Inflation vs Account-Level Problems
Rising platform prices are not a license to stop diagnosing. They are the baseline you diagnose against. In this order:
- Is my CPM rise roughly in line with the platform? US CPMs up 15% to 25% year over year is close to what Meta reported for US & Canada. That is the market.
- Is it much worse than that? Up 60% on the same audiences and objectives is not the auction. That is an account-level problem.
- What does frequency say? Rising frequency alongside rising CPM and falling CTR is the classic ad fatigue signature, and it is fixable with creative, not with budget.
- Did delivery move? Placement and geo mix shifts inside Advantage+ campaigns can change your blended CPM with no auction change at all. Check the placement breakdown first.
What You Can Actually Control
Three things, in order of leverage.
Creative variety. Genuinely distinct concepts, not color swaps. This is the only input that reliably changes how much of the auction you are eligible for.
Cost controls. If you have a hard margin ceiling, the platform's price trend is an argument for explicit constraints rather than open-ended lowest-cost bidding. A bid cap strategy will not make the auction cheaper, but it will stop you buying results above the price your unit economics allow.
Exclusions and structure. Cleaning up overlap, retargeting windows, and duplicate audiences is unglamorous, and it is where most self-inflicted CPM inflation lives.
What you cannot control is the clearing price. Budget for it.
Meta Earnings Call Takeaways for Advertisers
The Q2 call was a product roadmap wearing a finance costume. Three things in it change how you buy.
Ranking got more context. Zuckerberg said Meta has expanded the context its systems use to rank ads to include a person's organic and ads activity, which he credited with significant increases in relevance and conversions on both Facebook and Instagram. Li put numbers on it: new user-understanding models analyzing ads and organic activity, combined with Meta's GEM ranking model and sequence learning, produced an 8.3% increase in ad clicks and a 15.7% uplift in conversions on Facebook, while early LLM pilots for understanding user preferences produced a 1% increase in app-event conversions on Instagram. (Meta-reported model gains, not a promise your account gets the same lift.)
The direction is consistent with everything that has happened since Andromeda changed retrieval: the system decides more, your inputs decide less, and the inputs that still matter are the ones that make your ads conceptually distinguishable.
Creative tooling went mass-market. Meta said over 9 million small businesses now use at least one of its AI creative tools, and image generation adoption more than doubled during the quarter. Muse Image, the new model Meta is rolling out for ad creative, can analyze images, critique its own output, and produce better variations from advertiser input.
Advantage+ became the main product. Advantage+ end-to-end solutions passed $75 billion in annualized run-rate. Zuckerberg described the longer-term goal as a "business-in-a-box" service for starting and running a whole business on Meta's platforms, possibly priced through results-based auctions.
The practical implication for buyers: when 9 million businesses can generate competent creative on demand, production stops being a moat. Everyone's output floor rises at once, which puts more competent ads into the same auctions, and that is not a deflationary force. What survives as an edge is judgment about which concepts to test, plus the operational speed to get a genuinely diverse set live and measured before the market moves again.
Frequently Asked Questions About Meta Earnings
Save Hours on Creative Testing
Stop uploading ads one by one. Bulk process unlimited creatives with automatic media matching and direct API publishing.
Try Ads Uploader FreeNo credit card required • 7-day free trial
How Much Did Meta's Ad Prices Increase in 2026?
Meta's worldwide average price per ad rose 12% year over year in Q1 2026 and 12% again in Q2 2026, the second consecutive quarter at that rate. The regional picture was far wider than the blend: in Q2 2026, price rose 20% in US & Canada and 21% in Rest of World, 10% in Europe, and 1% in Asia-Pacific. Ad impressions delivered grew 14% worldwide, down from 19% in Q1.
What Does "Average Price per Ad" Mean in Meta's Earnings?
Meta's SEC filings define it as total advertising revenue divided by the number of ads delivered. It is the average amount paid per delivered ad across the Family of Apps, regardless of whether the advertiser optimized for an impression, a click, a conversion, or an app event. It is a platform-level monetization measure, not a rate card, and not the same thing as your CPM.
Why Are My Facebook CPMs Going Up if I Didn't Change Anything?
Auction prices move on inputs you do not control: more advertisers entering your auctions, competitors valuing the same person higher, shifting predicted action rates, delivery moving between placements and countries, currency, and seasonality. For Q2 2026, Meta attributed the 12% increase to ad performance gains, better macro conditions, and currency tailwinds, partly offset by fast impression growth on lower-monetizing surfaces.
Does Meta Officially Raise Ad Prices?
No. There is no rate card. Nearly all Meta inventory clears through an auction where your bid, budget, objective, and predicted outcomes compete with everyone else's, so the reported average price per ad is the realized outcome of all those auctions combined. Meta influences it indirectly through auction design, ranking models, ad load, and placement mix, but the published number is a result, not a decision.
When Does Meta Report Earnings Next?
Meta reported Q2 2026 on July 29, 2026. As of August 1, 2026, the Q3 2026 date had not been officially announced. Meta has reported third-quarter results in the last week of October for three years running (October 25, 2023, October 30, 2024, and October 29, 2025), so late October 2026 is the reasonable estimate. Confirm against Meta's investor relations site before you put it in the calendar.
What Time Is Meta's Earnings Call?
Meta reports after US market close and hosts the earnings call as a webcast on its investor relations site the same day. The exact start time is published in the advisory Meta posts ahead of each report, so take it from there rather than from a third-party ticker page. If you only want the advertiser numbers, you can skip the call entirely: average price per ad and ad impressions delivered are both in the press release, which goes out ahead of the webcast.
The Bottom Line on Meta Earnings
Meta earnings for Q2 2026 handed advertisers one number worth acting on: average price per ad rose 12% year over year, matching Q1, while impression growth slowed from 19% to 14%. In US & Canada the increase was 20% on just 9% more impressions, and that is the number most North American advertisers should be planning against. Advertising is 97.6% of Meta's revenue, capex is guided to $130-145 billion for 2026, and Meta's own explanation for rising prices starts with performance gains pulling more demand into the auction.
Three things to carry into next quarter's planning. Prices have risen year over year in eleven of the last twelve quarters and are now running at 12%, so budget for a higher baseline instead of treating each increase as an anomaly. The worldwide number is not your number, so read the regional slide for the geography you actually buy. And when costs rise, diagnose against the platform trend before you tear the account apart: a 15% increase on US inventory this quarter is the market doing exactly what Meta reported.
Bookmark this page. The tables above get a new row within days of every earnings call, so the series stays current instead of freezing at whatever quarter it was written in.