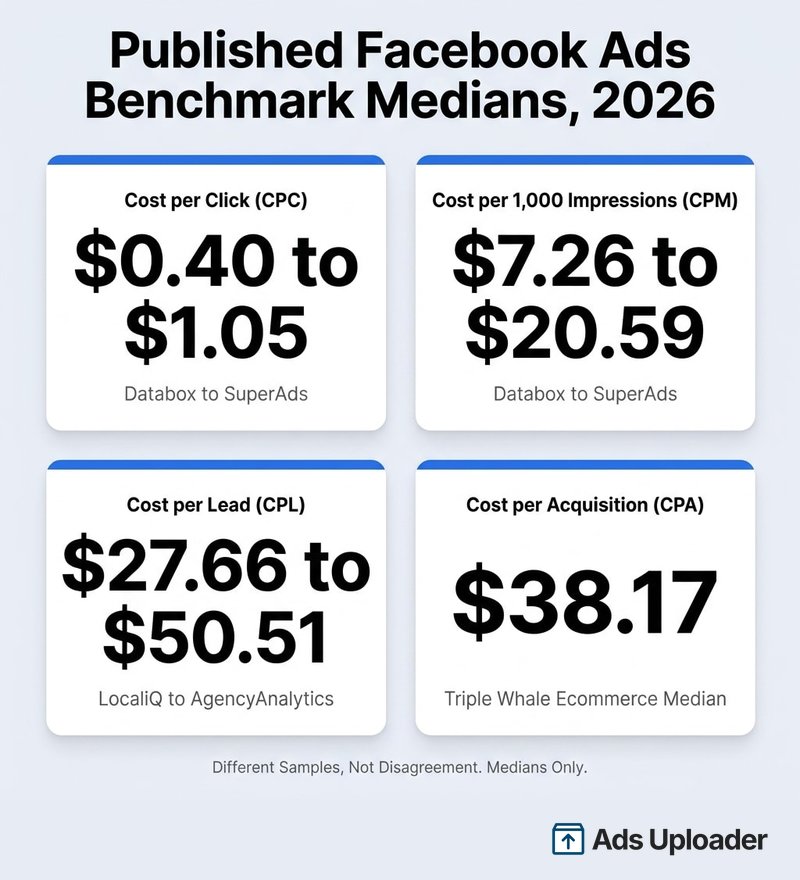
How much Facebook ads cost is set by an auction, not a rate card. Published 2026 benchmarks put median cost per click between $0.40 and $1.05, and median cost per 1,000 impressions between $7.26 and $20.59, with the spread driven by country, objective, and how each dataset was built. Meta bills most delivery per impression, so cost per click and cost per acquisition are outcomes rather than prices. The only number that decides anything is your break-even cost per result.
Search for what Facebook ads cost and the first page hands you a different answer every time you scroll. One dataset puts the median CPM at $7.26. Another puts it at $20.59. Both were updated in 2026, both are built on large samples, and neither is wrong.
They are measuring different populations. One cohort is made up of companies with a thousand employees or more. Another is nearly 35,000 ecommerce brands. A third is a global spend pool where a great deal of the delivery happens in markets where impressions cost a fraction of what they cost in Chicago. Put those side by side without the labels and you get a mess that looks like disagreement.
This guide handles that differently. Every figure below carries the name of the organisation that published it, the sample it came from, and the period it covers, so you can judge which one resembles your business. Then it adds the pricing number Meta reports about itself every quarter, which is the only cost data on this subject that comes from the company running the auction. It closes with the arithmetic that turns your own margin into a budget, because a benchmark only helps once you can act on it.
What Facebook Ads Actually Cost in 2026
Here are the current benchmarks worth quoting, with the sample attached to each one.
| Source | Sample | Headline figures |
|---|---|---|
| WordStream / LocaliQ, updated October 2025 | 554 traffic and 726 lead campaigns, US, April 2024 to June 2025 | $0.70 median traffic CPC, $1.92 lead-objective CPC, $27.66 median CPL |
| Triple Whale, updated April 2026 | Nearly 35,000 ecommerce brands, calendar 2025 | $13.48 median CPM, $38.17 median CPA, 2.19% CTR, 1.93 median ROAS |
| SuperAds, accessed August 2026 | Roughly $3 billion in spend, global, all industries | $20.59 CPM, $1.05 CPC, $44.10 CPL, $47.60 cost per purchase |
| Databox, updated August 2026 | 2,800-plus companies with 1,000 to 100,000 employees | $7.26 median CPM, $0.40 median all-click CPC, $17.04 cost per purchase |
| AgencyAnalytics, published January 2026 | December 2025 data from clients of 7,000-plus agencies across five English-speaking markets | $0.57 median CPC, $50.51 median CPL, $1,051.86 median monthly spend |
Two caveats belong right next to that table. These are third-party benchmark sets rather than our own account data. And every one of them is a median, which means half the advertisers in each sample paid more.
Why the Published Averages Disagree
Five differences explain almost all of the spread, and knowing them tells you which benchmark to trust for your own planning.
Advertiser mix. Triple Whale's cohort is dominated by ecommerce brands. AgencyAnalytics reflects agency clients. Databox's sample starts at a thousand employees. None of those populations buys media the way a local service business does.
Objective mix. Traffic clicks, lead submissions and purchases sit in different auction pools with different optimisation constraints. Blend them and the resulting average describes none of them.
Click definition. An all-click CPC counts reactions, profile taps and other interactions alongside link clicks. Outbound CPC uses a much smaller denominator, so it runs higher. Databox's $0.40 and SuperAds' $1.05 are both all-click figures, which is part of why neither matches WordStream's $0.70 traffic CPC.
Geography. SuperAds' global series includes substantial delivery in markets where CPMs run under $4. A US-only advertiser reading a global median is reading somebody else's market.
Aggregation method. A median account, a mean of monthly medians, and a spend-weighted mean answer three different questions. SuperAds' headline numbers are averages of thirteen monthly medians rather than pooled or spend-weighted figures, which is a meaningfully different calculation from Databox's straight median.
For planning, use the narrowest benchmark that matches your country, objective, industry and optimisation event. A wide global average blends too many markets and objectives to guide a single account.
What You Are Actually Billed For
How you are billed shapes a budget more than any benchmark does. Most Meta delivery is accounted for through impressions. Cost per click, cost per lead and cost per acquisition are figures you calculate afterwards, not prices you agree to in advance.
Work it through with round numbers. If your CPM is $10, a thousand impressions costs you ten dollars. Twenty clicks makes your CPC $0.50. Forty clicks makes it $0.25. You paid the same either way. The only thing that changed was how many people responded.
That is why creative work moves cost more reliably than bid tinkering does. Doubling your click-through rate halves your effective cost per click without you touching a single setting. Meta's ad auction documentation describes the winner as the ad with the highest total value, calculated from the bid, the estimated action rate, and ad quality. Two of those three inputs are creative and relevance problems.
Choosing a conversion objective does not change how you are billed. It changes who Meta looks for, which changes the auctions you enter, which changes what a thousand impressions costs you. The meter still runs on delivery.
Facebook Ad Costs by Country and Industry
Geography is the single biggest structural driver of cost, ahead of industry and well ahead of anything you can adjust in Ads Manager.
| Country | CPM | CPC |
|---|---|---|
| United States | $23.42 | $1.18 |
| United Kingdom | $17.38 | $1.18 |
| Australia | $14.38 | $0.95 |
| Canada | $13.05 | $0.90 |
| Brazil | $3.46 | $0.20 |
| India | $1.35 | $0.10 |
Figures from SuperAds' country series, averages of monthly medians for roughly July 2025 to July 2026. Treat them as directional rather than as a precise price index, since the underlying pages do not document currency normalisation consistently.
The gap between the United States and India is roughly seventeen to one on CPM. That is not a quality difference in the inventory. Advertisers can rationally bid more where an acquired customer is worth more, and denser competition for commercially valuable audiences pushes clearing prices up from there.
The practical consequence is worth acting on. If one ad set spans several countries with very different cost profiles, the cheap markets will absorb a disproportionate share of delivery while the expensive market you actually care about goes underserved. Splitting by geography costs you a little consolidation and buys back control over where the money lands.
Industry follows the same logic. In WordStream and LocaliQ's US lead-campaign sample, median cost per lead ran from $3.16 for restaurants and food to $76.71 for dentists, with lead-objective CPCs spanning $0.74 to $9.78 across the same verticals. A signed dental case is worth thousands of dollars, so dental practices can bid accordingly. A restaurant cover is worth forty, so restaurants cannot compete for the same impression and do not need to.
On the ecommerce side, Triple Whale's 2025 cohort put median cost per acquisition between $29.99 for lifestyle brands and $49.48 for electronics, with category CPMs from $10.01 in automotive to $20.70 in health. Notably, every category in that dataset saw CPMs rise during 2025, by between 8% and 38%, with the all-category average increase at 20%.
If lead generation is your objective, the vertical spread and the quality trade-offs behind it deserve a closer look in our guide to Facebook lead ads cost per lead.
Launch More. Click Less.
Upload hundreds of creatives at once, auto-match thumbnails to videos, and export directly to Meta Ads Manager.
Try Ads Uploader FreeNo credit card required • 7-day free trial
The Cost That Does Not Appear in Ads Manager
One line item belongs in any 2026 cost article, because it sits outside the campaign budget entirely. Since 1 July 2026, Meta has passed Digital Service Tax costs through to advertisers as location fees: 5% on delivery in Austria and Turkey, 3% in France, Italy and Spain, and 2% in the United Kingdom.
The fee is determined by where impressions land, not where your business is registered, and Meta adds it after delivery rather than taking it from your budget. A $10,000 month delivered entirely in Italy invoices at $10,300 before VAT. If your reporting reconciles Ads Manager spend against the invoice, expect a gap in those six markets.
Why Facebook Ad Costs Keep Rising, According to Meta
Benchmark posts describe where costs have been. Meta publishes where they are going, every ninety days, and we track those figures for advertisers each quarter in our Meta earnings for advertisers report.
The metric is average price per ad, which Meta's SEC filings define as total advertising revenue divided by the number of ads delivered. Here are the last two quarters.
| Metric | Q1 2026 | Q2 2026 |
|---|---|---|
| Average price per ad, worldwide | +12% | +12% |
| Average price per ad, US and Canada | +14% | +20% |
| Average price per ad, Europe | +19% | +10% |
| Average price per ad, Asia-Pacific | +5% | +1% |
| Ad impressions delivered, worldwide | +19% | +14% |
All figures are year-over-year changes reported by Meta in its Q2 2026 results release and the accompanying earnings presentation, published 29 July 2026.
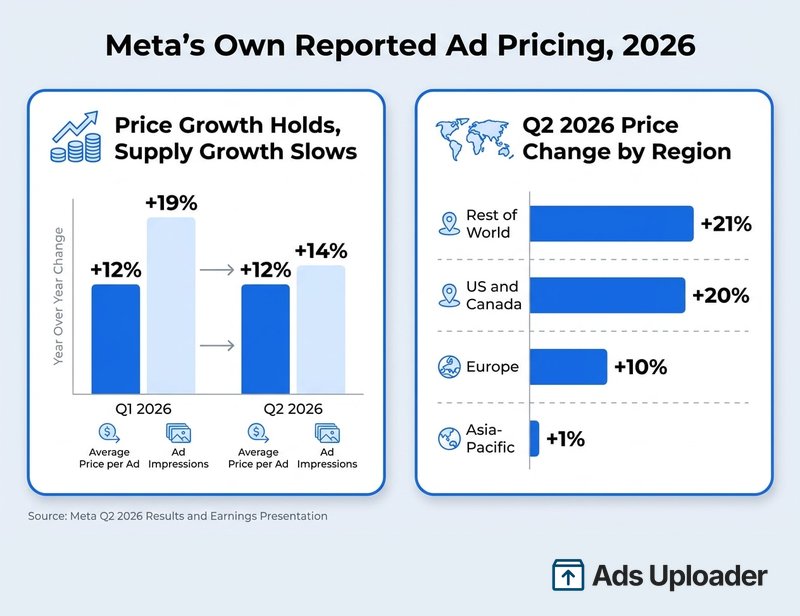
Two things in that table matter for planning.
First, price growth is holding at 12% for a second consecutive quarter while impression growth decelerates, from 19% to 14%. Supply growth is slowing and price growth is not. If you are modelling next year's budget on the assumption that this year's CPM carries forward flat, that assumption is working against the trend.
Second, the worldwide figure hides a sharp regional split. In Q2, average price per ad rose 20% in the United States and Canada and 21% in Rest of World, but only 10% in Europe and 1% in Asia-Pacific. A North American advertiser reading the 12% headline is reading somebody else's number.
What This Metric Is Not
Average price per ad is not your CPM, and the difference matters before anyone builds a forecast on it.
Your CPM is your spend divided by the impressions you bought. Meta's figure is total advertising revenue divided by every ad delivered across Facebook, Instagram, Messenger, WhatsApp and the rest. Its denominator mixes objectives, countries, placements and advertiser types, and it is published as a percentage change rather than a dollar price. Meta has also noted that Reels currently monetises at lower rates than Feed and Stories, so shifts in surface mix move the number on their own.
A 12% rise in that aggregate does not mean your CPM rose 12%. It still works as a directional signal, because it comes from the company setting the prices rather than from a sample of somebody's clients.
Why Prices Rose
Meta attributed the Q2 increase principally to stronger advertiser demand, better ad targeting and ranking performance, an easier macroeconomic comparison against Q2 2025, and favourable currency movements. Those forces were partly offset by fast impression growth in lower-monetising countries and surfaces.
The performance piece is the part that compounds. Meta disclosed that newly deployed prediction and ranking systems generated 8.3% more Facebook ad clicks and 15.7% more Facebook conversions in its own tests during the quarter. Those are Meta's measurements of Meta's systems rather than a promise about your account, but the mechanism is straightforward. When the platform converts better, advertisers bid more confidently, and the auction clears higher for everyone in it.
Rising prices are often linked to Meta's capital spending, which the company guided to $130 to $145 billion for 2026 at Q2, narrowed from $125 to $145 billion at Q1. That link is real but indirect. Capex buys compute and data centres, which improve ranking and conversion, which raise what advertisers are willing to pay. It is not a surcharge divided among accounts, and Meta's own explanation for the price increase did not mention its infrastructure bill at all.
For the platform changes that land between these quarterly reports, we keep a running log in our Meta Ads updates roundup.
Save Hours on Creative Testing
Stop uploading ads one by one. Bulk process unlimited creatives with automatic media matching and direct API publishing.
Try Ads Uploader FreeNo credit card required • 7-day free trial
Minimum Budget: What Meta Requires and What Actually Works
Three different numbers hide behind the phrase "minimum budget", and conflating them is how small accounts end up with expensive, unreadable results.
The technical minimum is set inside Ads Manager, based on your currency, objective, optimisation event and bid configuration. There is no single universal figure. The $1, $5 and $40 per day table that circulates widely traces back to much older Meta guidance and does not appear in current documentation, so treat it as folklore rather than policy.
Meta's public starting guidance is modest and slightly ambiguous. On its ad budgets page, Meta suggests starting with at least $5 and running over more than six days, and separately advises funding at least seven days so the delivery system can learn. The page does not clearly state whether that $5 is daily or total, so it is not safe to quote as an official $5-per-day minimum. The same page does state the overspend rule plainly: Meta may spend up to 75% above your daily budget on a high-opportunity day, while weekly spend stays within seven times the daily figure. Plan against the weekly number.
The practical minimum is set by how many results you need to see. Meta's own help documentation is blunt about the learning phase: performance is less stable and cost per acquisition is usually worse while an ad set is still learning. The useful formula connects budget to evidence rather than to a rule of thumb:
Daily ad set budget = target cost per result x desired weekly results ÷ 7
At a $40 target CPA, five conversions a week needs about $29 per day, ten needs about $57, and twenty needs about $114. You will see a widely repeated claim that ad sets need exactly 50 optimisation events in seven days. That figure comes from older Meta guidance and cannot be verified as a current hard rule, so treat it as a rough sense of scale rather than a threshold to engineer around.
This also answers whether $5 a day works. It runs. At SuperAds' global benchmarks it buys roughly 243 impressions or 4.8 clicks a day, and about one lead every nine days. That is enough to validate an audience or run cheap traffic. It is not enough to judge a purchase campaign in any reasonable timeframe.
Where the budget sits, at campaign level or ad set level, changes how Meta distributes it. We cover that trade-off in ABO vs CBO.
How to Budget for Facebook Ads by Goal
Start from your own numbers rather than anybody's benchmark. The sequence is the same regardless of objective.
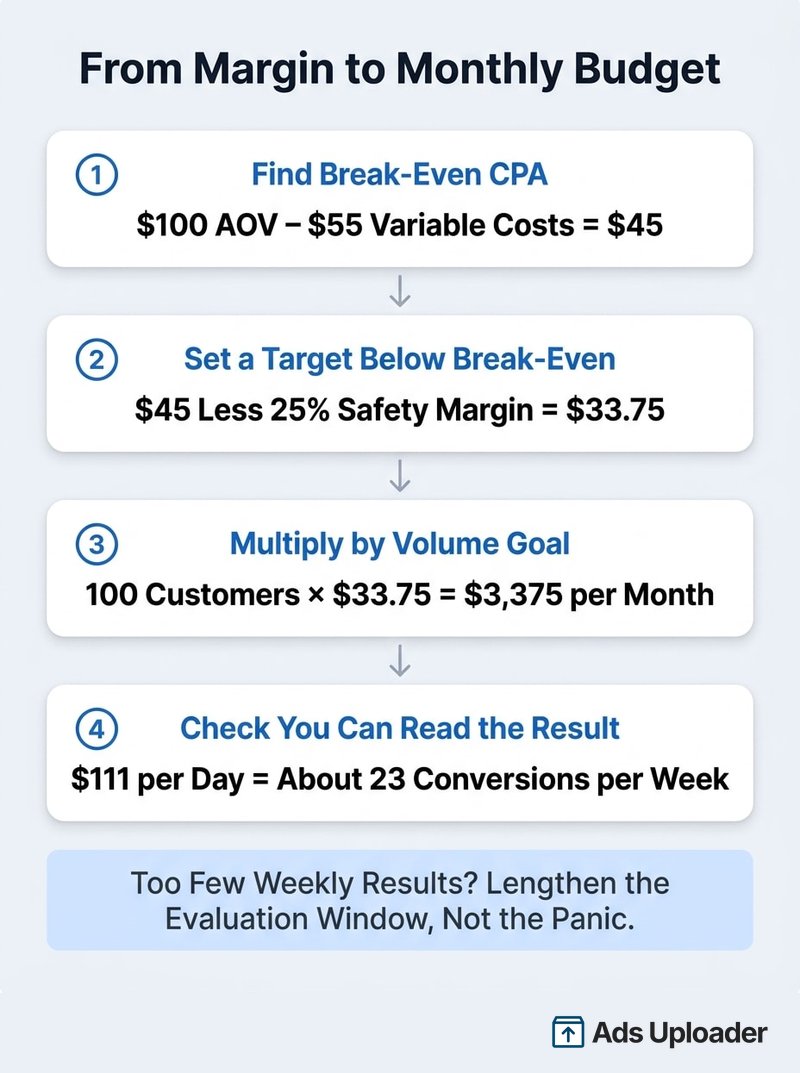
Step 1: Calculate your break-even cost per acquisition. That is average order value minus product cost, fulfilment, payment fees and expected refunds. A $100 order with $55 of variable cost leaves $45 of contribution, so $45 is your ceiling.
Step 2: Set a target below it. Break-even is a wall, not a goal. A 25% safety margin puts the operational target at $33.75.
Step 3: Multiply by your volume goal. One hundred customers a month at $33.75 is $3,375 in media.
Step 4: Check that the daily figure buys enough results to read. $3,375 a month is about $111 a day, which at a $33.75 target should produce roughly 23 conversions a week. That is a readable signal. Had the answer come out at three conversions a week, the useful response is a longer evaluation window rather than a weekly panic.
For lead generation the same logic applies with one extra step: break-even cost per lead is your close rate multiplied by contribution per sale, minus what it costs your team to work each lead. Ten percent of leads closing into $500 of contribution gives you $50 gross, before sales time.
One more figure belongs here. Break-even ROAS is one divided by your contribution margin. At a 45% margin, break-even is 2.22. Triple Whale's 2025 ecommerce cohort produced a median Meta ROAS of 1.93, which means the median brand in that sample was returning less than its break-even at a typical margin. Revenue at twice your ad spend is not automatically profit.
| Monthly budget | What it realistically supports |
|---|---|
| Under $500 | One ad set, one audience, awareness or traffic. Too thin for reliable conversion optimisation |
| $500 to $2,000 | Genuine testing of three to five creatives against one or two audiences, over a 60 to 90 day read |
| $2,000 to $7,500 | Prospecting plus retargeting, with 20% to 30% held back for continuous creative testing |
| $7,500 to $25,000 | Full-funnel coverage across multiple objectives with enough event volume for stable optimisation |
| $25,000 and above | Scaling proven creative, where creative production becomes the binding constraint rather than budget |
What Drives Your Cost in the Auction
Six levers account for most of the variance between two advertisers with identical budgets.
Auction competition. You are not bidding against a price, you are bidding against everyone who wants the same person at the same moment. Meta notes that audiences of at least two million often perform better, largely because a bigger pool gives delivery more cheap impressions to choose from. Treat that as platform guidance rather than a threshold, since plenty of local advertisers succeed nowhere near two million.
Ad quality and estimated action rate. Both feed directly into the total value score that decides the auction, which is why a relevant ad can beat a higher bid. Meta has historically exposed this through quality, engagement rate and conversion rate rankings. What it has never published is a fixed discount attached to any ranking, so be sceptical of anyone quoting one.
Campaign objective. Conversion objectives cost more per click than traffic objectives because they chase a smaller, more contested group. That is the design working, not a penalty. The expensive mistake is running a traffic objective and expecting conversion-quality outcomes at traffic prices.
Bid strategy. Highest volume spends the budget for maximum results. Cost per result goal steers toward an average and may underdeliver if the target is unrealistic. Bid cap limits the maximum auction bid, which caps what you pay per auction rather than what you pay per conversion. More cost control always means more delivery constraint. We walk through when caps earn their keep in our bid cap strategy guide.
Seasonality. Q4 is reliably the expensive quarter. Gupta Media's monthly series put 2024 Q4 CPM at $9.79 against $6.65 in Q1, and recorded a $17.70 CPM on Cyber Monday. Triple Whale's 2025 Black Friday analysis of more than 33,000 shops found a $22.26 Meta CPM, about 8% above the prior year. If your promotion can move, moving it out of late November is worth more than most optimisation work.
Creative response and frequency. Costs drift upward as engagement weakens on a stale audience. The useful signal is a combination: frequency climbing while reach stalls, outbound click-through falling, and conversion rate deteriorating. Frequency alone proves nothing, and the popular rule that costs spike above a frequency of three has no credible evidence behind it. We cover diagnosis and refresh cadence in Facebook ad fatigue.
How to Lower Your Facebook Ad Costs
Ordered by what typically moves the number most, with the evidence flagged where it is thin.
- Fix the offer and the creative first. Because you are billed on delivery, click-through rate is a direct lever on effective cost per click. A hook that doubles CTR halves your CPC with no change to bidding.
- Consolidate ad sets. Splitting a small budget across many ad sets keeps all of them starved of results. Fewer ad sets with real event volume almost always read better than more ad sets with fragments.
- Give delivery room. Broader placements and larger audiences let the system find cheap impressions. Meta reports that Advantage+ options lower costs in its own studies, by around 9% on sales campaigns and 14% on lead CPL, though those are promotional results from selected samples. Test them against a controlled baseline rather than assuming the lift.
- Improve the conversion signal. Server-side events through the Conversions API alongside the Pixel give the optimiser a cleaner picture of who converted. Meta has published a 13% CPA improvement figure for this, but it dates to 2022 and is best treated as directional.
- Match creative to the placement. Meta's split tests found 9:16 video with sound outperforming still images in Reels by 34.5% on cost per result. That is a Reels-specific finding, not evidence that video always beats static everywhere.
- Move flexible spend out of peak weeks. Awareness budget that does not need to run in November will go noticeably further in January.
Notice what is missing from that list: chasing cheap hours, cheap placements and narrow micro-audiences. Those tactics made sense when advertisers controlled delivery directly. Under current auction and ranking systems they mostly constrain the optimiser without producing a durable saving.
Key Takeaways
Facebook ads cost what the auction says they cost, which is why every published average is a starting range rather than a target.
- Published 2026 medians run from $0.40 to $1.05 per click and $7.26 to $20.59 per thousand impressions. Which one applies to you depends mostly on your country, your objective and how the dataset defines a click.
- Most delivery is billed on impressions, so cost per click and cost per acquisition are outcomes. Improving click-through rate lowers your effective CPC without touching a bid.
- Meta's own reported pricing rose 12% year over year in both Q1 and Q2 2026, and 20% in the United States and Canada in Q2, while impression growth slowed from 19% to 14%. Model rising costs into next year's plan rather than assuming this year's number holds.
- There is no universal minimum budget. Ads Manager sets a technical floor from your configuration, and the practical floor is whatever buys enough results to evaluate inside a useful window.
- Break-even decides everything. Work out contribution per order or per lead first, then judge every published benchmark against it, and remember that break-even ROAS is one divided by your margin.
Run that arithmetic on your own numbers before comparing yourself to anyone's table. A $40 cost per acquisition is excellent for a business with $120 of contribution per sale and fatal for one with $30. The benchmarks tell you what the market is paying. Only your margin tells you what you can afford.