Meta user statistics come from quarterly earnings releases, where the company reports Family daily active people rather than per-app user counts. In Q2 2026, reported July 29, 2026, Family daily active people reached 3.60 billion, up 3% year over year from 3.48 billion. Family average revenue per person was $16.86. Meta stopped publishing Facebook and Family monthly active user numbers after Q4 2023, so any per-app figure circulating now is either a dated disclosure or a third-party estimate. Meta's own error margin on the estimate is roughly 3%.
Search for how many people use Meta and you will get four different numbers within the first page of results: 3.98 billion, 3.6 billion, 3.43 billion, and 3.07 billion. All four are real. Three of them describe something other than Meta's current audience, and one of them has not been published by Meta since January 2024.
Meta changed which audience metrics it reports in 2024, retiring the Facebook-specific numbers, and the stat roundups that rank for this query mostly did not notice. So they keep republishing a monthly figure Meta retired, alongside per-app counts Meta no longer breaks out, with no date attached to either.
If you are sizing a market, writing a deck, or trying to work out whether your rising CPMs have anything to do with the size of the audience, you need the number Meta actually publishes and you need to know what it counts.
This page tracks every Meta user statistic that comes from a primary source, with the quarter it refers to and whether Meta reported it or an executive mentioned it in passing. It also flags the widely repeated figures that do not hold up. It gets updated after each earnings release, alongside our Meta earnings for advertisers report.
How Many Users Does Meta Have in 2026?
Meta's only recurring audience metric is Family daily active people (DAP). Here is the current reported picture, all from the Q2 2026 release of July 29, 2026.
| Metric | Q2 2026 | Change | Does Meta report this? |
|---|---|---|---|
| Family daily active people | 3.60 billion | +3% YoY | Yes, quarterly |
| Family average revenue per person (ARPP) | $16.86 | vs $13.65 in Q2 2025 | Yes, quarterly |
| Ad impressions delivered | +14% YoY | vs +11% a year earlier | Yes, quarterly |
| Average price per ad | +12% YoY | vs +9% a year earlier | Yes, quarterly |
| Facebook MAU, Instagram MAU, WhatsApp users | not disclosed | last reported Q4 2023 | No |
| DAP or ARPP by region | not disclosed | never reported | No |
Source: Meta's Q2 2026 results release.
Meta defines a daily active person as a registered and logged-in user of Facebook, Instagram, Messenger, or WhatsApp who visited at least one of those products through an app or browser on a given day. Two details matter and both get lost in the roundups:
- It is deduplicated. If you open WhatsApp, scroll Instagram, and reply to a Messenger thread today, Meta counts you once. It matches accounts using signals like device information, IP address, and username, without asking anyone to link their accounts.
- It is a monthly average, not a snapshot. The 3.60 billion figure is the average daily count across June 2026, not the number of people who logged in on June 30.
Meta is also explicit that this is an estimate requiring significant judgment, with a stated error margin of roughly 3% of worldwide DAP. At 3.60 billion, 3% is about 108 million people. That is a wide band, and it is a good reason not to read too much into a single quarter's movement. Meta also said that after a methodology update, accounts it considers solely violating, including bots and spam, represented less than 5% of worldwide DAP in Q4 2025.
For a running view of what shipped alongside these numbers, the Meta Ads updates log covers the product changes quarter by quarter.
Meta Daily Active Users by Quarter
The full reported series, each row taken from the quarterly results release for that period.
| Quarter | Measured | Family DAP | YoY change |
|---|---|---|---|
| Q1 2023 | March 2023 average | 3.02 billion | +5% |
| Q2 2023 | June 2023 average | 3.07 billion | +7% |
| Q3 2023 | September 2023 average | 3.14 billion | +7% |
| Q4 2023 | December 2023 average | 3.19 billion | +8% |
| Q1 2024 | March 2024 average | 3.24 billion | +7% |
| Q2 2024 | June 2024 average | 3.27 billion | +7% |
| Q3 2024 | September 2024 average | 3.29 billion | +5% |
| Q4 2024 | December 2024 average | 3.35 billion | +5% |
| Q1 2025 | March 2025 average | 3.43 billion | +6% |
| Q2 2025 | June 2025 average | 3.48 billion | +6% |
| Q3 2025 | September 2025 average | 3.54 billion | +8% |
| Q4 2025 | December 2025 average | 3.58 billion | +7% |
| Q1 2026 | March 2026 average | 3.56 billion | +4% |
| Q2 2026 | June 2026 average | 3.60 billion | +3% |
Source: Meta quarterly results releases, Q1 2023 through Q2 2026.
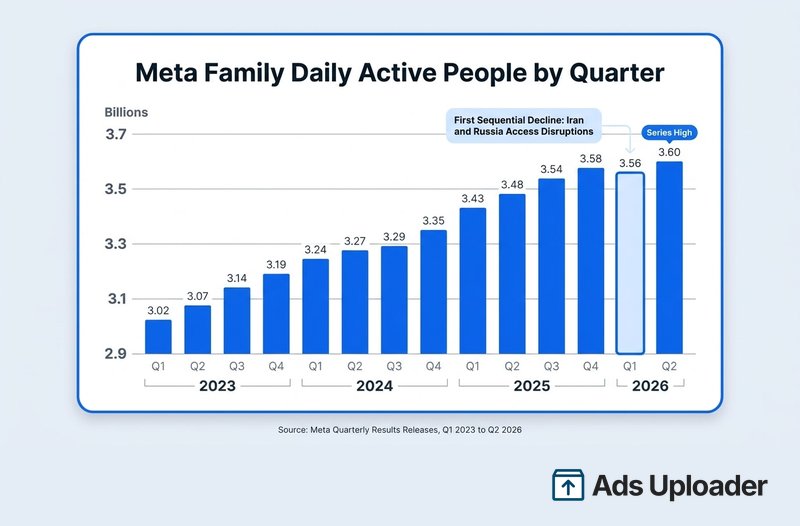
Two things stand out. The series added roughly 580 million people since early 2023, and the annual growth rate has been compressing: 7% and 8% through 2023 and 2024, 6% to 8% through 2025, then 4% and 3% in the first half of 2026. Meta first reported a metric called Family daily active people on January 29, 2020, at 2.26 billion.
Why Meta's Daily Active Users Fell in Q1 2026
Q1 2026 was the first quarter-over-quarter decline in the series: 3.58 billion in Q4 2025 down to 3.56 billion. That produced a run of headlines about Meta losing 20 million users, which is worth unpacking, because three separate things are true at once.
Meta gave a specific cause. The Q1 2026 release attributed the change to internet disruptions in Iran and a restriction on access to WhatsApp in Russia. On the call, CFO Susan Li said that without those two effects, Meta estimated DAP would have grown sequentially. Some coverage also floated Australia's teen social media restrictions as a contributing factor. Meta did not say that, and it is worth treating as journalist speculation rather than an explanation from the company.
The annual trend never turned negative. Q1 2026 was down against Q4 2025, but up 4% against Q1 2025. A quarter-on-quarter dip and a year-on-year decline are very different events, and the headlines mostly used the language of the second while describing the first.
Twenty million is a rounding artefact. Meta publishes DAP to two decimal places in billions. The gap between 3.58 and 3.56 is 20 million by subtraction, but it sits well inside the roughly 3% error margin Meta attaches to the metric. The direction is real. The precision is not.
Q2 2026 settled the question. Meta said Iranian access was largely restored during the quarter, and DAP recovered to 3.60 billion, a new high for the series.
DAP vs MAU: Why Meta's Monthly Active Users Number Disappeared
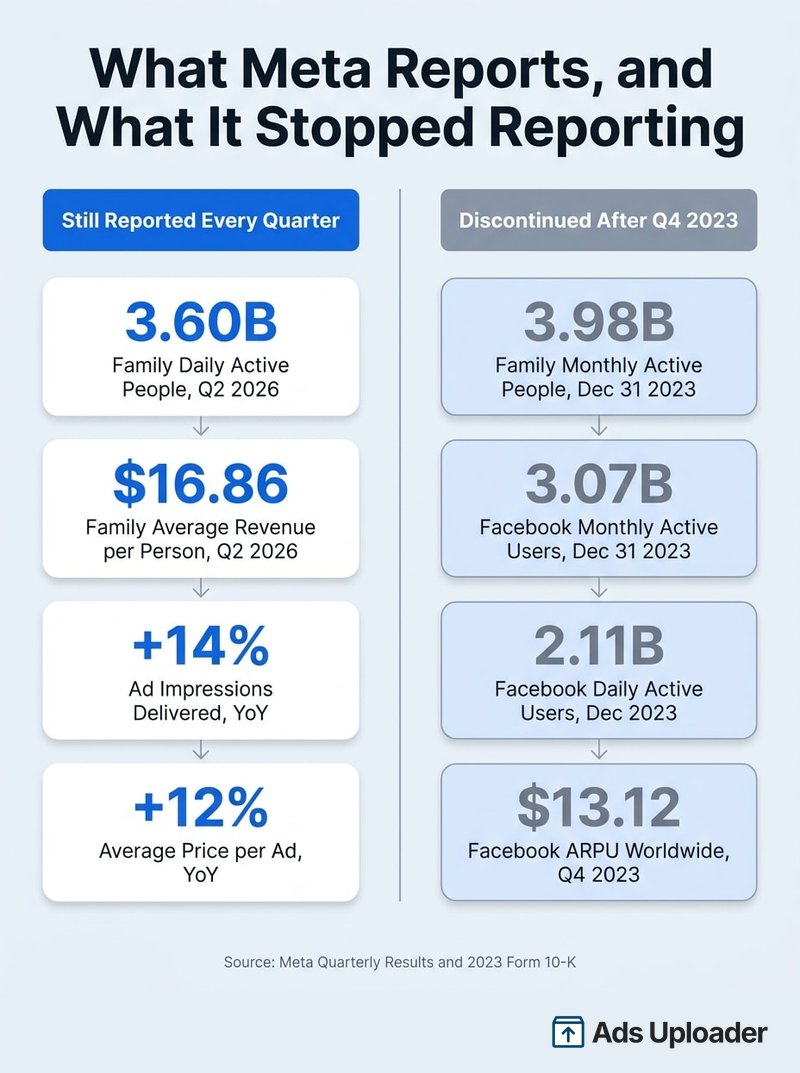
If you are looking for Meta monthly active users, you are looking for a metric that no longer exists. Meta retired Family monthly active people (MAP) alongside the Facebook-specific numbers after Q4 2023.
The distinction between the two was never just daily versus monthly:
- DAP is the estimated unique people active on at least one qualifying Family app on a given day, reported as the average across the quarter's final month.
- MAP counted people active in the preceding 30 days as of a measurement date, normally quarter end. It was a point-in-time figure, not an average.
The final MAP disclosure was 3.98 billion as of December 31, 2023. That number is still the single most republished Meta user statistic on the web, usually presented as a current monthly total. It is a real Meta figure. It is also more than two years old and no longer maintained.
One more definitional note: Threads and Meta AI do not qualify a person for DAP on their own. The metric covers Facebook, Instagram, Messenger, and WhatsApp. A Threads-only user is not in the 3.60 billion.
Per-App User Numbers Meta No Longer Reports
Beginning with Q1 2024 reporting, Meta stopped publishing Facebook DAU, Facebook MAU, Facebook ARPU, and Family MAP. Susan Li put it plainly on the Q4 2023 call: the company was transitioning away from reporting Facebook-specific metrics. The reasoning in the 10-K was that Family metrics better reflect both the size of the community and the reality that most people use more than one Meta product.
Here is what those series looked like when they stopped.
| Discontinued metric | Final value | As of | Basis |
|---|---|---|---|
| Facebook daily active users | 2.11 billion | December 2023 | Monthly average |
| Facebook monthly active users | 3.07 billion | December 31, 2023 | Point in time |
| Family monthly active people | 3.98 billion | December 31, 2023 | Point in time |
Source: Meta's 2023 Form 10-K.
Since then, per-app figures have surfaced only as executive remarks on earnings calls or in newsroom posts. They are genuine statements from Meta, but they are milestones rather than a series: no methodology note, no error margin, no consistent cadence, and no guarantee of a comparable figure next quarter.
| Product | Figure | Metric | Who said it, and when |
|---|---|---|---|
| 2 billion | Daily actives | Mark Zuckerberg, July 29, 2026 | |
| More than 2 billion | Daily actives | Mark Zuckerberg, July 29, 2026 | |
| More than 3 billion | Monthly actives | Mark Zuckerberg, January 29, 2025 | |
| More than 3 billion | Monthly actives | Mark Zuckerberg, April 30, 2025 | |
| Messenger | More than 1 billion | Monthly users | Mark Zuckerberg, April 30, 2025 |
| Threads | 500 million | Monthly actives | Mark Zuckerberg, July 29, 2026 |
| Meta AI | More than 1 billion | Monthly users | Meta newsroom, October 2025 |
Source: Meta earnings call transcripts and newsroom posts on the dates shown.
The practical rule that follows: never add these together. Two billion Instagram dailies plus two billion Facebook dailies plus three billion WhatsApp monthlies is close to seven billion, which is most of the planet and obviously wrong. The overlap is enormous, and deduplicating it is exactly what DAP does. Any reach estimate built by summing app-level numbers is inflated by roughly a factor of two.
For actual planning, the number that matters is not any of these. It is the estimated audience size Ads Manager returns for your specific targeting, placements, and geography, which is a different calculation again. Meta's audience targeting options determine that figure far more than the global totals do.
Meta ARPU and ARPP Explained
Meta's revenue-per-user metric changed name and formula at the same time the user metrics did. Facebook ARPU is gone. Family average revenue per person (ARPP) replaced it.
The current definition, from the Q1 2026 Form 10-Q, is Family of Apps revenue during a given quarter divided by the average of the number of daily active people at the beginning and end of that quarter.
| Quarter | Worldwide ARPP |
|---|---|
| Q1 2024 | $11.20 |
| Q2 2024 | $11.89 |
| Q3 2024 | $12.29 |
| Q4 2024 | $14.25 |
| Q1 2025 | $12.36 |
| Q2 2025 | $13.65 |
| Q3 2025 | $14.46 |
| Q4 2025 | $16.56 |
| Q1 2026 | $15.66 |
| Q2 2026 | $16.86 |
Source: Meta quarterly filings and earnings presentations, Q1 2024 through Q2 2026.
The seasonality is obvious once you look for it: Q4 spikes on holiday ad demand, Q1 gives some of it back. Strip that out and the trend is steep. ARPP rose about 51% between Q1 2024 and Q2 2026 while DAP rose about 11% over the same window. Monetization per person, not audience growth, is doing nearly all the work.
Three caveats keep this number honest:
ARPP is not advertising revenue per person. It uses total Family of Apps revenue, which includes other revenue like WhatsApp paid messaging and subscriptions. In Q2 2026 that was $60.370 billion of Family of Apps revenue: $59.363 billion from advertising and $1.007 billion from other sources, the latter up 73% year over year.
The pre-2024 numbers are not comparable. The older ARPP used total revenue divided by average Family MAP. Q4 2023 was originally published at $10.10 under that formula and recast to $12.33 under the current one. If you build a long time series by splicing the two, the trend line is wrong.
It is Meta's revenue per person, not your cost per person. ARPP tells you what Meta earned from the average user across an entire quarter and every advertiser competing for them. It is not a CPM, not a budget benchmark, and not something to compare your own cost per reach against.
Launch More. Click Less.
Upload hundreds of creatives at once, auto-match thumbnails to videos, and export directly to Meta Ads Manager.
Try Ads Uploader FreeNo credit card required • 7-day free trial
Meta Users by Region: What Is and Is Not Published
A regional table of Meta revenue per user circulates widely, usually labelled as ARPP, showing figures like $68 for US and Canada against $4 or $5 for Rest of World. Those numbers are real, but they are the discontinued Facebook-only ARPU series, and they are frozen at Q4 2023:
| Region | Facebook ARPU, Q4 2023 |
|---|---|
| US & Canada | $68.44 |
| Europe | $23.14 |
| Asia-Pacific | $5.52 |
| Rest of World | $4.50 |
| Worldwide | $13.12 |
Source: Meta's 2023 Form 10-K. This series was discontinued and has not been updated since.
Meta publishes neither DAP by region nor ARPP by region. What it does publish by user geography, apportioned by its estimate of where the user was rather than where the advertiser is billed, is revenue, impression growth, and price growth.
| User geography | Q2 2026 revenue | Share of total |
|---|---|---|
| US & Canada | $26.816 billion | 44.1% |
| Europe | $14.296 billion | 23.5% |
| Asia-Pacific | $11.164 billion | 18.4% |
| Rest of World | $8.525 billion | 14.0% |
| Total | $60.801 billion | 100% |
Source: Meta's Q2 2026 earnings presentation.
That 44.1% is a revenue share, not a user share. In the last year Meta disclosed regional per-user revenue, US and Canada ARPU ran more than 11 times Asia-Pacific ARPU. A region can produce nearly half the revenue on a fraction of the people. Which region has the most Meta users is something Meta no longer tells us, though the old Facebook series pointed to Asia-Pacific.
Where the regional data does earn its keep is in the supply and price series:
Ad impressions delivered, year over year change by region
| Quarter | US & Canada | Europe | Asia-Pacific | Rest of World |
|---|---|---|---|---|
| Q2 2025 | +9% | +6% | +16% | +7% |
| Q3 2025 | +8% | +9% | +23% | +9% |
| Q4 2025 | +13% | +13% | +24% | +14% |
| Q1 2026 | +13% | +17% | +23% | +17% |
| Q2 2026 | +9% | +13% | +17% | +12% |
Average price per ad, year over year change by region
| Quarter | US & Canada | Europe | Asia-Pacific | Rest of World |
|---|---|---|---|---|
| Q2 2025 | +11% | +17% | +2% | +15% |
| Q3 2025 | +13% | +19% | +1% | +20% |
| Q4 2025 | +9% | +12% | -2% | +15% |
| Q1 2026 | +14% | +19% | +5% | +18% |
| Q2 2026 | +20% | +10% | +1% | +21% |
Source: Meta's Q2 2026 earnings presentation, slides 12 and 13.
Asia-Pacific has run the fastest impression growth for five straight quarters while its price per ad has barely moved, and went slightly negative in Q4 2025. US and Canada is the mirror image: the slowest supply growth in Q2 2026 at 9%, and the joint-fastest price growth at 20%. The pattern is consistent. New inventory is appearing where monetization is lowest, and prices are climbing where it is highest.
What Meta's User Growth Means for Advertisers
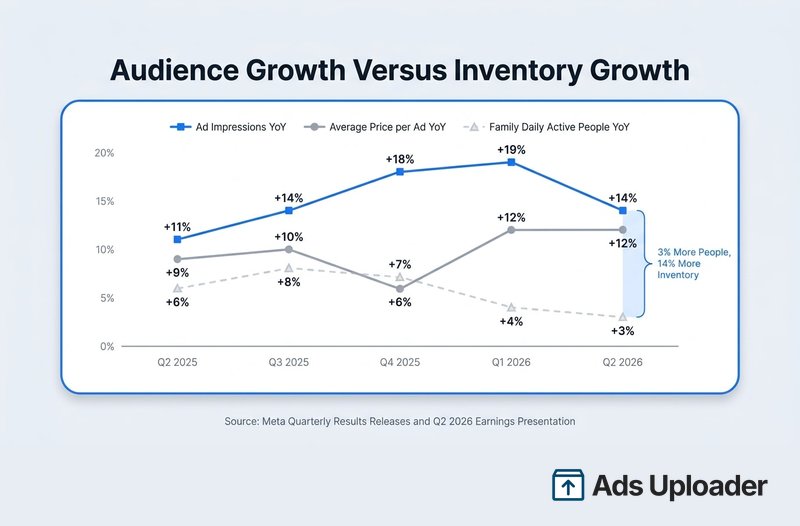
Put the two headline numbers next to each other and the useful insight falls out. In Q2 2026, Meta's user base grew 3% and its ad impressions grew 14%.
That gap is the whole story. Set the two rates against each other and roughly four fifths of the extra inventory in your auctions came from something other than new people joining Meta. That is rough arithmetic rather than a Meta disclosure, but the direction is not in doubt: Susan Li attributed impression growth to engagement growth, user growth, and ad load optimizations, in that order of framing. Working backwards, the supply is coming from:
- More time from the same people. Instagram global time spent grew at a double-digit rate year over year in Q2 2026, driven by Feed and Reels recommendation improvements. Facebook video time rose 9% globally and more than 10% in US and Canada.
- More ads inside that time. Meta describes this as optimizing which person, placement, and moment gets an ad, balanced against organic engagement. It has not published a maximum ad load.
- New surfaces. Threads advertising completed its global expansion in Q2 2026, and Meta added more destinations and objectives to WhatsApp Status ads while working toward a global rollout.
Three practical consequences follow.
Supply growth is not making inventory cheaper. Impressions grew 14% and average price per ad still rose 12% in the same quarter. Demand is absorbing the new supply faster than it arrives. If your CPMs are up and your account has not changed, platform-level pricing is a plausible part of the explanation.
Incremental reach has to come from you, not from Meta's growth. At 3.60 billion daily actives growing 3% a year, the addressable audience is roughly fixed from one quarter to the next. Practically, that means placement coverage and creative volume are the levers that expand your reach, not waiting for the platform to add people. Running the full placement set matters more than it did when the base was growing 8% a year.
Audience-based tactics face a shrinking edge, but not zero. With a flat base and Meta's delivery systems doing more of the matching, the returns on narrow interest stacking keep falling. First-party inputs are the exception. A well-maintained custom audience built from your own customer data still gives Meta a signal it cannot derive from the platform's scale, and a lookalike audience seeded from a high-value segment is still one of the few audience inputs that reliably earns its place in a mature account.
Frequently Asked Questions
How Many Users Does Meta Have in 2026?
Meta reported 3.60 billion Family daily active people on average during June 2026, up 3% year over year. That is Meta's estimate of the unique people who used Facebook, Instagram, Messenger, or WhatsApp on an average day that month, deduplicated so that someone using three apps counts once. It is not a sum of app-level users, a count of registered accounts, or a monthly figure. Meta attaches an estimated error margin of roughly 3% to it.
Does Meta Still Report Facebook Monthly Active Users?
No. The final formal disclosure was 3.07 billion Facebook monthly active users as of December 31, 2023. Facebook MAU, Facebook DAU, Facebook ARPU, and Family monthly active people were all discontinued starting with Q1 2024 reporting. Mark Zuckerberg has since said Facebook has more than 3 billion monthly actives and more than 2 billion daily actives, but those are one-off remarks on earnings calls, not a restarted reporting series.
What Is Meta's ARPU or Average Revenue per Person?
Meta reports Family average revenue per person, or ARPP, which was $16.86 worldwide in Q2 2026. It is Family of Apps revenue for the quarter divided by the average of daily active people at the start and end of that quarter. Facebook-only ARPU was retired after Q4 2023. Meta does not publish ARPP by region, so any regional per-user dollar figure you see is either the old Facebook ARPU series or someone's estimate.
Save Hours on Creative Testing
Stop uploading ads one by one. Bulk process unlimited creatives with automatic media matching and direct API publishing.
Try Ads Uploader FreeNo credit card required • 7-day free trial
Why Did Meta's Daily Active Users Decline in Q1 2026?
Family daily active people fell from 3.58 billion in Q4 2025 to 3.56 billion in Q1 2026, the first quarter-over-quarter decline since Meta started reporting the metric. Meta attributed it to internet disruptions in Iran and a restriction on access to WhatsApp in Russia. Iranian access was largely restored during Q2 2026 and the figure recovered to 3.60 billion. Year over year, Q1 2026 still grew 4%.
How Many People Use Instagram Every Day?
Mark Zuckerberg said Instagram reached 2 billion daily actives on the Q2 2026 earnings call, held July 29, 2026. That is an official statement from Meta, but it is not a recurring reported metric, so it carries none of the methodology notes or error margins attached to Family daily active people. Meta has not published a per-app user series since Q4 2023.
What Is the Difference Between DAP and MAU?
Daily active people counts the estimated unique people active on at least one of Facebook, Instagram, Messenger, or WhatsApp on a given day, reported as the average across the final month of the quarter. Monthly active users counted registered Facebook users active in the previous 30 days as of a specific date. DAP deduplicates across apps, so someone on Facebook and Instagram counts once. App-level monthly figures cannot be added together because the audiences overlap heavily.
Which Region Has the Most Meta Users?
Meta does not publish daily active people by region, so there is no sourced answer. US and Canada produced the most revenue in Q2 2026 at $26.816 billion, about 44% of the total, but that reflects far higher revenue per person rather than a larger population. The discontinued Facebook-only series historically showed Asia-Pacific with the largest user base, which is a reasonable directional hint but not a current disclosure.
When Does Meta Publish Updated User Numbers?
Worldwide daily active people and ARPP are updated with each quarterly earnings release, usually in late January, April, July, and October. Q2 2026 was reported on July 29, 2026. As of August 1, 2026, Meta had not officially announced the Q3 2026 date. Recent third-quarter reports landed on October 25, 2023, October 30, 2024, and October 29, 2025, so late October 2026 is the reasonable expectation.
The Short Version
If you take five things from this page, take these.
- 3.60 billion is the number. Family daily active people, average across June 2026, up 3% year over year, with a roughly 3% error margin around it.
- Anything per-app is a milestone, not a series. Instagram's 2 billion dailies and WhatsApp's 3 billion monthlies came from earnings calls. Meta stopped reporting per-app users after Q4 2023, and the 3.98 billion monthly figure still circulating is a December 2023 disclosure.
- ARPP replaced ARPU, and it is not just ads. $16.86 in Q2 2026, calculated on total Family of Apps revenue including WhatsApp paid messaging and subscriptions. Regional ARPP does not exist.
- Revenue share is not user share. US and Canada delivered 44% of Q2 2026 revenue on a fraction of the people, because per-person monetization there runs many times higher than in Asia-Pacific.
- Inventory is growing more than four times faster than the audience. Users up 3%, impressions up 14%, price per ad up 12%. Supply is coming from engagement and ad load, and it is not making the auction cheaper.
Meta user statistics age faster than almost any other number in this business, because the company keeps changing which ones it publishes. The habit worth building is simple: whenever you meet one, look for the quarter attached to it. A good share of the figures in circulation are accurate for a date somewhere in 2023, and stating a stale number with confidence is a harder mistake to walk back than saying you will go and check.