This is the archive of Meta's Q2 2026 earnings read for advertisers, written after the July 29, 2026 report and kept as it stood. The latest quarter and every data table back to 2022 live on the Meta earnings tracker for advertisers.
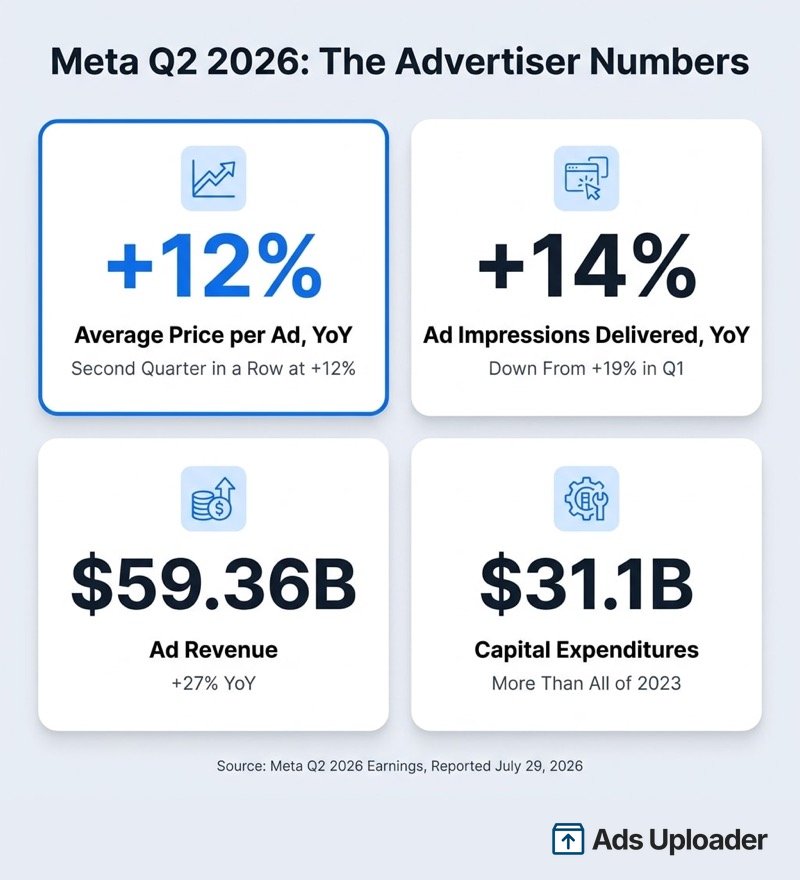
Meta released its second-quarter 2026 results on July 29, 2026, after US market close. The top line was strong: revenue of $60.801 billion, up 28% year over year, with advertising revenue of $59.363 billion, up 27%. Diluted EPS of $6.18 was the part that disappointed. For media buyers, the two figures that mattered were further down the release: average price per ad up 12% and ad impressions delivered up 14%.
Meta Q2 2026 Results: The Key Numbers
| Metric | Q2 2026 | vs Q2 2025 |
|---|---|---|
| Average price per ad | +12% YoY | +9% a year earlier |
| Ad impressions delivered | +14% YoY | +11% a year earlier |
| Advertising revenue | $59.363B | +27% |
| Total revenue | $60.801B | +28% |
| Operating income | $18.775B | -8% |
| Operating margin | 31% | 43% a year earlier |
| Net income | $15.848B | -14% |
| Diluted EPS | $6.18 | -13% |
| Capital expenditures | $31.08B | $17.01B a year earlier |
| FY2026 expense guidance | $165-169B | lower end raised |
| FY2026 capex guidance | $130-145B | narrowed from $125-145B |
Source: Meta's Q2 2026 results release.
The profit line is where the market flinched. Diluted EPS of $6.18 came in under a FactSet analyst consensus of roughly $7.14 (that consensus figure comes from press coverage, not from Meta). Costs and expenses included $2.40 billion of charges related to legal proceedings and $1.18 billion of severance tied to the May 2026 headcount reduction. CFO Susan Li said that excluding those two items, operating income would have risen 9% year over year rather than falling 8%.
None of the profit noise touched the auction, though. Two other lines in the release did.
The first is the streak. 12% in Q1 2026, 12% again in Q2 2026. In the four-year series, that is the first time price growth has held at 12% or higher for two straight quarters.
The second is the gap between price and supply. Impression growth fell five points in one quarter, from 19% to 14%, while price growth held flat. Advertisers were paying the same or more for inventory that was growing more slowly, which is how an auction tightens long before anyone notices it in their own account.
The Q2 2026 rows for price per ad, impressions, revenue, capex and the regional splits sit alongside every quarter since Q1 2022 in the quarterly tables on the Meta earnings tracker.
US & Canada Took the Biggest Price Increase in Q2 2026
Meta's earnings presentation splits price and impressions by where the user was, and in Q2 2026 that split told a very different story from the headline. Price per ad in US & Canada rose 20%, against 12% worldwide, while US & Canada impression growth was the slowest of any region at 9%. Rest of World was slightly higher still on price at +21%, and Europe rose 10%.
Asia-Pacific pulled the worldwide figure down, with price up just 1% on 17% more impressions. So a North American advertiser whose costs rose by well over 12% that quarter was seeing the regional market at work, not a problem in the account.
Why Impression Growth Slowed to 14%
Worldwide impressions grew 14% in Q2 2026 after 19% in Q1. Meta gave no single explicit reason for the five-point deceleration. Li said growth was healthy across all regions, driven by engagement growth, user growth, and ad load optimizations. Context sits nearby: Family daily active people were up 3% on a year earlier in Q2, down from 4% in Q1, and Q1 had been depressed by internet disruptions in Iran and WhatsApp restrictions in Russia, with Iranian access largely restored during Q2. (Anything beyond that is our analysis, not Meta's explanation.)
Paired with price growth holding at 12%, that slowdown meant a fixed budget bought less reach than it had a year earlier. In US & Canada, at +20% price on +9% impressions, it bought noticeably less.
Q2 2026 Capex and Margins
Advertising made up 97.6% of Meta's Q2 2026 revenue: $59.363 billion of $60.801 billion. With Q2 results, Meta narrowed its 2026 capex guidance to $130-145 billion, from $125-145 billion, and raised the low end of its expense guidance to $165-169 billion. Q2 capex alone was $31.08 billion, more than Meta spent in the whole of 2023.
Operating margin fell from 43% in Q2 2025 to 31%, though roughly half that compression came from the legal charges and severance rather than infrastructure. Free cash flow was $784 million on nearly $61 billion of revenue.
Meta's stated reasons for the Q2 price increase were ad performance gains, improved macro conditions versus Q2 2025, and currency tailwinds. The first of those is the only real link between the data center bill and auction prices: better models lift measured results, and better results raise what advertisers are willing to bid (our read, not Meta's claim).
Launch More. Click Less.
Upload hundreds of creatives at once, auto-match thumbnails to videos, and publish straight to your ad accounts through Meta's API.
Try Ads Uploader FreeNo credit card required • 7-day free trial
What Q2 2026 Meant for Your CPMs
Gil David, founder of the agency Run DMG, summed up the Q2 report for advertisers on LinkedIn: "You're shopping in the same store but the price of bread sneaked up."
His point holds. The account had not changed that quarter. The going rate had.
Third-party panels of real ad accounts showed CPMs moving the same way through 2025, and our Meta ads statistics page collects those benchmarks next to Meta's own figures.
A useful check for that quarter: a US account whose CPMs rose somewhere around 15% to 25% year over year was tracking the market. A jump several times larger on unchanged audiences and objectives pointed to something inside the account, and the tracker keeps the checklist for telling the two apart.
Q2 2026 Earnings Call Takeaways for Advertisers
The Q2 call was a product roadmap wearing a finance costume. Three things in it change how you buy.
Ranking got more context. Zuckerberg said Meta has expanded the context its systems use to rank ads to include a person's organic and ads activity, which he credited with significant increases in relevance and conversions on both Facebook and Instagram. Li put numbers on it: new user-understanding models analyzing ads and organic activity, combined with Meta's GEM ranking model and sequence learning, produced an 8.3% increase in ad clicks and a 15.7% uplift in conversions on Facebook, while early LLM pilots for understanding user preferences produced a 1% increase in app-event conversions on Instagram. (These are Meta's own reported gains, and individual accounts will vary.)
That continued the shift that began when Andromeda changed retrieval: more of the targeting decision moved to Meta's models and less sat with advertiser settings.
Creative tooling went mass-market. Meta said over 9 million small businesses now use at least one of its AI creative tools, and image generation adoption more than doubled during the quarter. Muse Image, the new model Meta is rolling out for ad creative, can analyze images, critique its own output, and produce better variations from advertiser input.
Advantage+ became the main product. Advantage+ end-to-end solutions passed $75 billion in annualized run-rate. Zuckerberg described the longer-term goal as a "business-in-a-box" service for starting and running a whole business on Meta's platforms, possibly priced through results-based auctions.
For buyers, the point was that once 9 million businesses could produce decent creative on demand, production quality stopped being a differentiator. The advantage moved to choosing which concepts to test and getting a varied set of them live quickly.
Frequently Asked Questions About Meta's Q2 2026 Earnings
How Much Did Meta's Ad Prices Increase in Q2 2026?
In Q2 2026, Meta's average price per ad was up 12% on a year earlier, the same rate as in Q1 2026. By region: US & Canada +20%, Rest of World +21%, Europe +10%, and Asia-Pacific +1%. Worldwide ad impressions grew 14%, slowing from 19% in Q1.
Save Hours on Creative Testing
Stop uploading ads one by one. Bulk process unlimited creatives with automatic media matching and direct API publishing.
Try Ads Uploader FreeNo credit card required • 7-day free trial
Why Did Meta's Ad Prices Rise in Q2 2026?
Meta attributed the 12% increase in average price per ad to ad performance gains, improved macro conditions versus Q2 2025, and currency tailwinds, partly offset by fast impression growth on lower-monetizing surfaces.
Why Did Meta's Profit Fall in Q2 2026 When Revenue Grew 28%?
Costs and expenses included $2.40 billion of charges related to legal proceedings and $1.18 billion of severance tied to the May 2026 headcount reduction. Operating income fell 8% to $18.775 billion and diluted EPS was $6.18. CFO Susan Li said that excluding those two items, operating income would have risen 9% year over year.
Where Can I Find the Latest Meta Earnings Numbers?
This page is the archived Q2 2026 read. The Meta earnings tracker for advertisers carries the latest quarter and the full quarterly tables for price per ad, ad impressions, revenue, capex, and the regional splits back to Q1 2022, updated within days of every earnings call.
The Bottom Line on Meta's Q2 2026 Earnings
Meta's Q2 2026 earnings gave advertisers one figure to act on: average price per ad up 12% year over year for a second straight quarter, with impression growth slowing from 19% to 14%. North America felt it most, at 20% higher prices on 9% more impressions. Behind that sat a company earning 97.6% of its revenue from ads, guiding 2026 capex to $130-145 billion, and crediting performance gains first for the price rise.
The lessons from that quarter: prices had risen year over year in eleven of the previous twelve quarters, so plan for a higher cost baseline rather than treating each increase as a one-off. Use the regional figure for the market you buy, not the worldwide average. And check rising costs against the platform before you change an account that is working. What happened next is on the Meta earnings tracker.